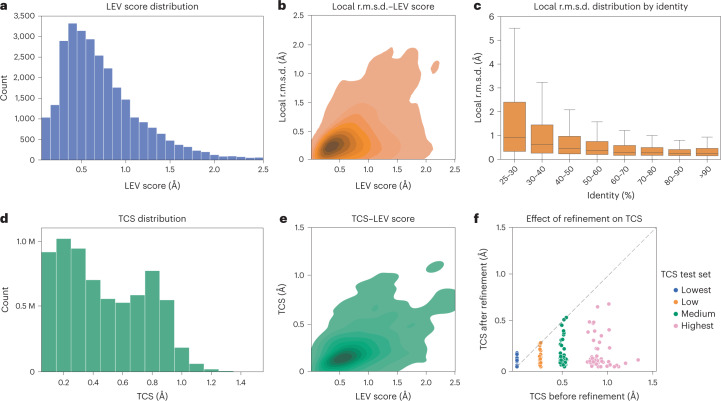
Fig. 1. Validation of the AlphaFill algorithm.
a, Distribution of the LEV score of all transplants obtained with 100% sequence identity (the validation set with n = 28,619 independent observations). 408 transplants (1%) with LEV score >2.5 are not shown for clarity. b, The local r.m.s.d. correlates with the LEV score in the validation set, Pearson correlation coefficient 0.51 (n = 8,039; mono-atomic transplants were not used (main text)). c, Distribution of the local r.m.s.d. of all transplants in the AlphaFill models as boxplots in 10% identity ranges. Boxes are based on 3,594,940; 3,866,810; 2,079,705; 1,005,953; 495,357; 369,307; 268,904 and 252,681 transplants, respectively, and extend from first to third quartile with the median as the middle line. Whiskers extend to 1.5 times the interquartile range. For clarity, 332,771; 333,325; 181,126; 79,594; 42,273; 34,634; 29,368 and 24,263 outliers, respectively, are not shown. Maximum values are 107.4, 82.1, 40.6, 37.1, 61.5, 44.4, 35.6 and 35.5 Å. d, The distribution of the TCS for all transplants in the AlphaFill models (n = 6,859,380). Mono-atomic transplants (5,170,409 compounds) are left out (main text). e, The TCS correlates with the LEV score in the validation set (n = 8,039; mono-atomic transplants were used (main text)), Pearson correlation coefficient 0.51. f, Comparison of the TCS before and after energy minimization for four subsets of the validation set (each with n = 50), illustrating that TCS improves for low until highest TCS by refinement.

