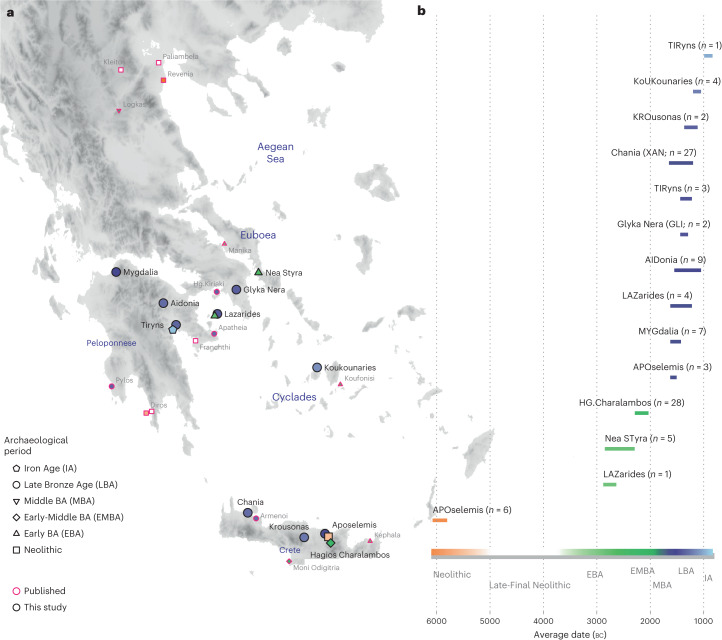
Fig. 1. Location and dates of individuals with newly generated aDNA data.
a, Geographical distribution of archaeological sites mentioned in the study annotated by period. Sites with smaller symbols of light outline refer to the published datasets that are co-analysed and follow the same symbol/colour scheme. Data obtained from the same site but different periods, are annotated with jittering points. b, The number of individuals analysed and their date range based on archaeological chronology or radiocarbon dating. Site names are abbreviated in three-letter capitalized identifiers as indicated in the labels. E, Early; M, Middle; L, Late. See also Supplementary Tables 2 and 3.

