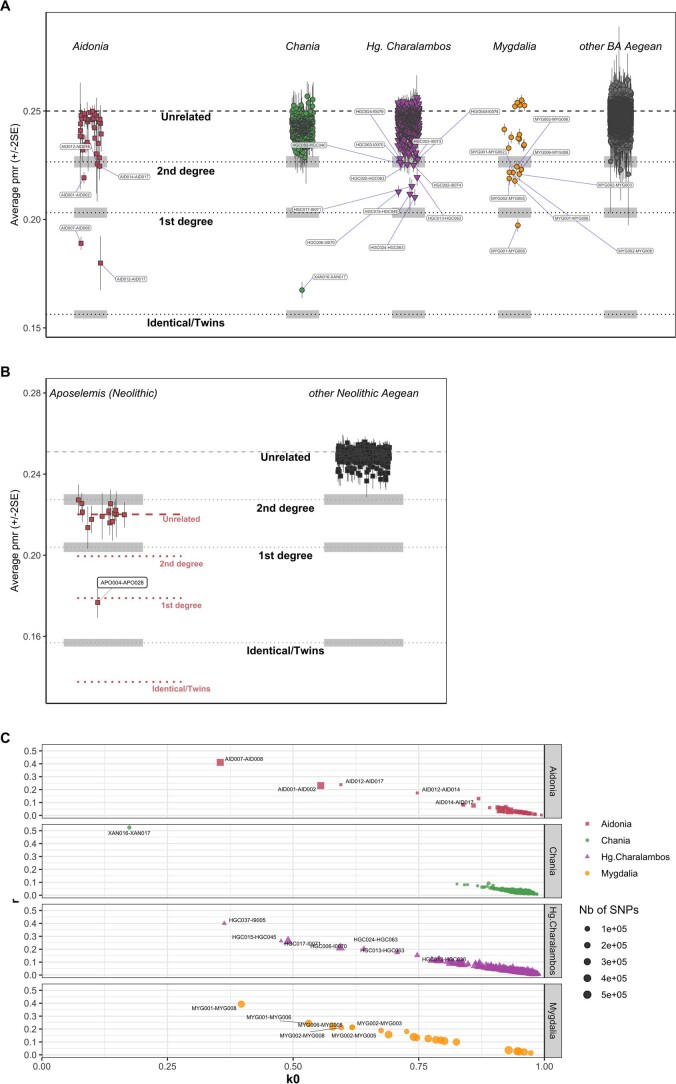
Extended Data Fig. 4. Estimation of genetic relatedness with two different methods.
A. The pairwise differences (P0) were computed with READ and are plotted as ±2SE of the mean. The dashed line indicates the median value calculated from all pairwise comparisons used for normalization (baseline of unrelatedness). Dotted lines show the cutoffs for the classification to second and first degrees and identical/twins. Confidence intervals were calculated by the software and are indicated in gray shadows. Results are provided separately for sites with related individuals. B. READ results for Neolithic Aposelemis in comparison to other Aegean Neolithic sites from the Greek mainland and Western Anatolia (mean pairwise differences with ±2SE) suggest that the baseline of unrelatedness might be lower for the Aposelemis population, and normalization of P0 produces lower cutoffs for close relatives (light-red lines). In this scenario, APO004 and APO028 are second-degree relatives. Because SNP ascertainment influences P0 values, only individuals enriched for 1240K, or in silico genotyped on these SNPs were included. C. lcMLkin analysis. Scatterplot of k0 against r for sites displaying pairs of relatives. First and up to third-degree relatives from Mygdalia are distinguished by both methods, as well as several pairs from Hagios Charalambos and Chania.

