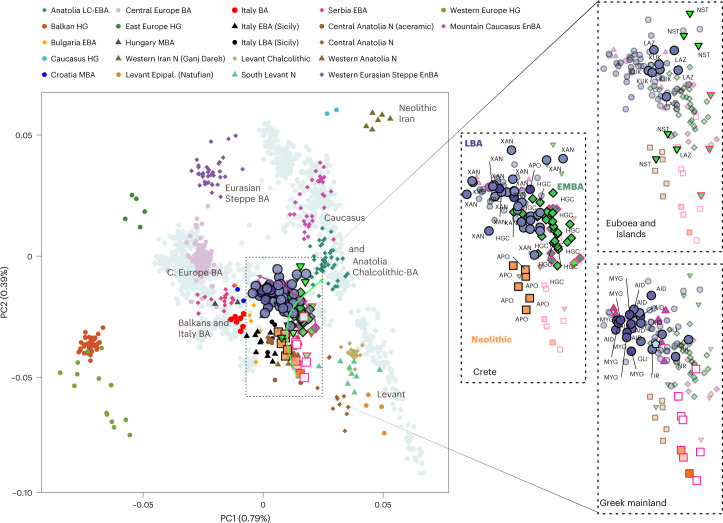
Fig. 2. West Eurasian PCA (grey background points) with projection of ancient Aegean and other ancient relevant populations (coloured points).
The arrows indicate the two major observed genetic shifts: from the Neolithic (N) to the EBA and from the MBA to the LBA. A zoom-in of coordinates for the Aegean samples is given and is subdivided by region (right). In every panel, the coordinates of the counterparts are plotted in the background in faded colours. The three-letter identifier of every individual is plotted as well. HG, hunter-gatherers; Epipal., Epipalaeolithic.

