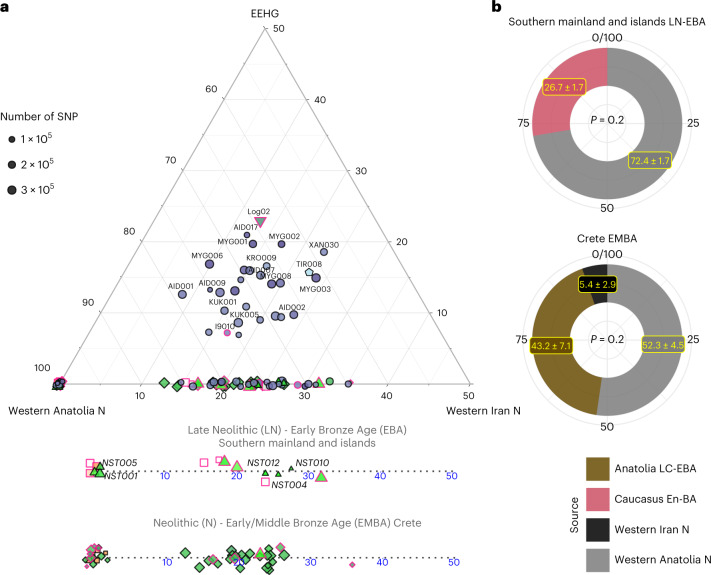
Fig. 3. Admixture modelling with qpAdm per individual and group.
a, Ternary plot for a three-way admixture model of Aegean individuals using the distal sources of ceramic farmers from Western Anatolia, Western Iranian farmers from Ganj Dareh and the EEHG, all dating to about 6000 bc. Because qpAdm is based on allele frequency differences, modelling of individual targets has a lower resolution especially when the SNP coverage is low. A few of the Late-Final Neolithic (LN) and EBA individuals show additional ancestry related to Neolithic Western Iran. To better visualize the fluctuation or Iranian-like coefficients among the LN-E/MBA individuals, the Anatolian–Iranian axis is also provided separately for Crete and the mainland islands. Fitting models were chosen with a cutoff of P ≥ 0.01, with only four individuals falling in the lower range (0.01 ≤ P < 0.05). b, Allele frequencies are averaged among all LN-EBA individuals from the southern mainland and all EMBA Cretan individuals and modelled using proximal in time and space source populations. For the former, a source proxy from the Eneolithic/BA Caucasus fits better than Anatolia, whereas the opposite holds for Crete. However, for the latter, the model becomes adequate with the inclusion of additional low contribution from Neolithic Iran. P values and standard errors of mean were calculated by the qpAdm program applying a likelihood ratio test and the 5 cM block jackknifing method, respectively. No correction for multiple testing has been made. See also Extended Data Fig. 1 and Supplementary Tables 4–7.

