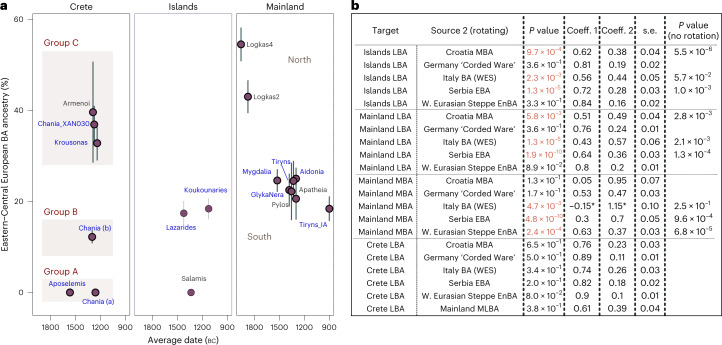
Fig. 4. Proximal two-way qpAdm models for the MLBA groups.
a, Estimated mean coefficient (coeff.) (±1 s.e.) of additional ancestry (WES-related) using as proxy a BA Central European population (‘Germany LN-EBA Corded Ware’). For every group we assumed local ancestry in the models using the ascending population from the corresponding area (that is, EMBA Crete, LN-EBA southern Greek mainland and islands or LN northern mainland (for Logkas). Newly reported LBA groups are annotated in blue letters. Before we applied the modelling on every ‘Site_Period’ group, we performed a test of cladality among all individuals which suggested substructure within the LBA site of Chania in Crete and resulted in three analysis groups. Overall, individuals from LBA Crete are distributed in three groups of non-overlapping WES-related ancestry estimations (A, B and C). Models are supported with P ≥ 0.05, with the exception of Tiryns_IA and Pylos with P = 0.02 and 0.04, respectively. b, Modelling results using the approach of rotating competing sources 2 in the right populations set (R11) (Supplementary Note 2) for Crete, the mainland and the islands. Low P values (<0.01) indicate poor fit of the tested model and are annotated in red. For these models, the P values are compared with the model fit without rotation of the sources. The gradual shift in Crete can be explained with admixture from the mainland but other proximal sources fit equally well. P values and standard errors of mean were calculated by the qpAdm program applying a likelihood ratio test and the 5 cM block jackknifing method, respectively. No correction for multiple testing has been made. See also Extended Data Fig. 2 and Supplementary Tables 8 and 9.

