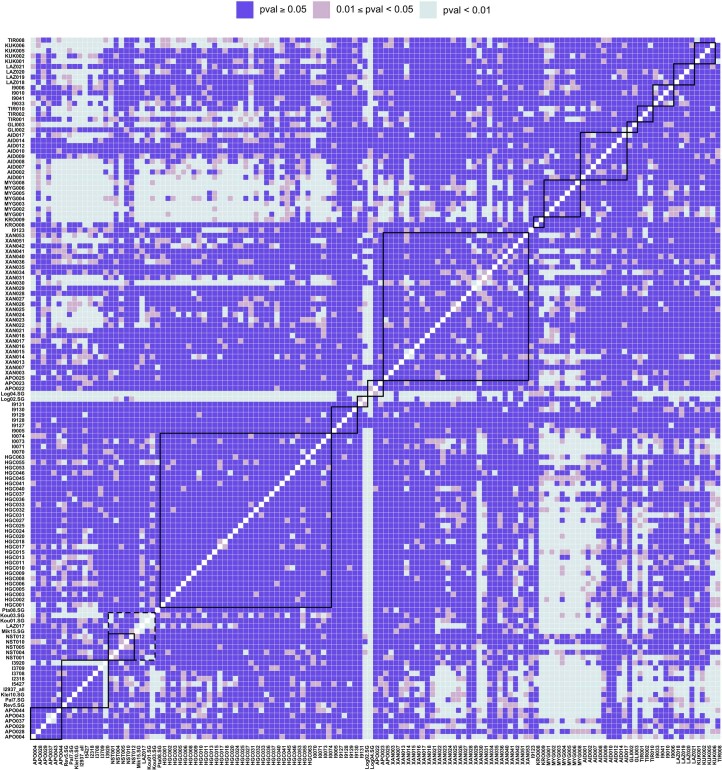
Extended Data Fig. 1. Heatmap of pairwise qpWave tests.
Low P values (conventionally < 0.05) are interpreted as a poor fit of the model and as more than one stream of ancestries being needed to explain the pair. Solid-line squares annotate clusters of individuals that date to the same period and come from the same archaeological site. Dashed-line square annotates Early Bronze Age (EBA) individuals from the islands of Euboea, Aegina and Koufonisia in Cyclades. Results are plotted in decreasing chronological order (Neolithic-Iron Age). We applied R11 (Supplementary Note 2) as a set of reference populations (‘right pops’). P values were calculated by the qpWave program applying a likelihood ratio test. No correction for multiple testing was performed.

