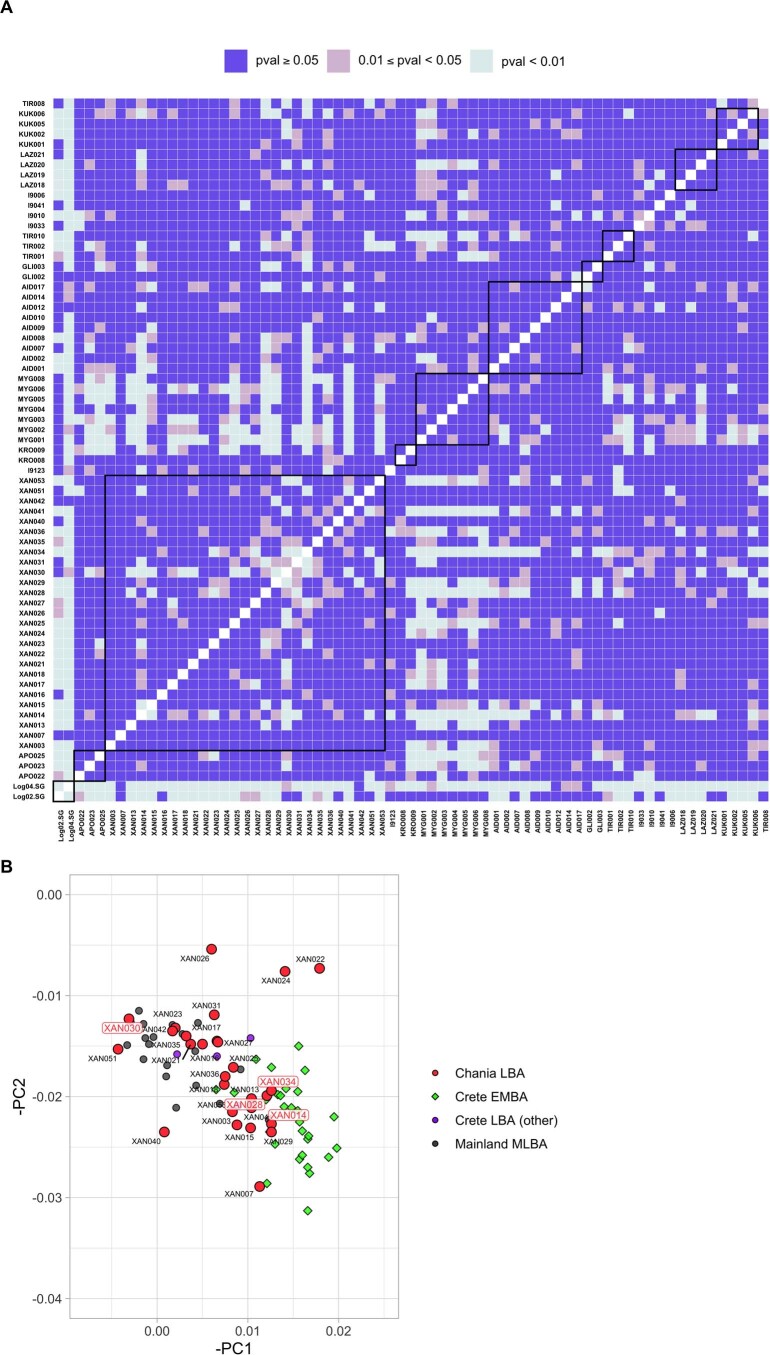
Extended Data Fig. 2. Heatmap of pairwise qpWave tests and comparison with PCA coordinates.
A. Test of streams of ancestry necessary to explain a pair of individuals from a set of reference populations for the Middle/Late Bronze Age and one Iron Age individual from Tiryns. We repeated the analysis presented in Extended Data Fig. 1 by adding to the set of reference populations (R11) ‘W. Eurasian Steppe En-BA’. This setting increased the rate of non-cladal pairs (P < 0.01; at least two streams of ancestry) only among individuals from Chania (XAN) and led us to analyse Chania in three subgroups. P values were calculated by the qpWave program applying a likelihood ratio test. No correction for multiple testing was performed. B. The PC1-PC2 coordinates from the Western Eurasian PCA displaying XAN individuals with their IDs. Those analysed separately are annotated in red letters (XAN014, XAN028 and XAN034 were grouped together and XAN030 apart).

