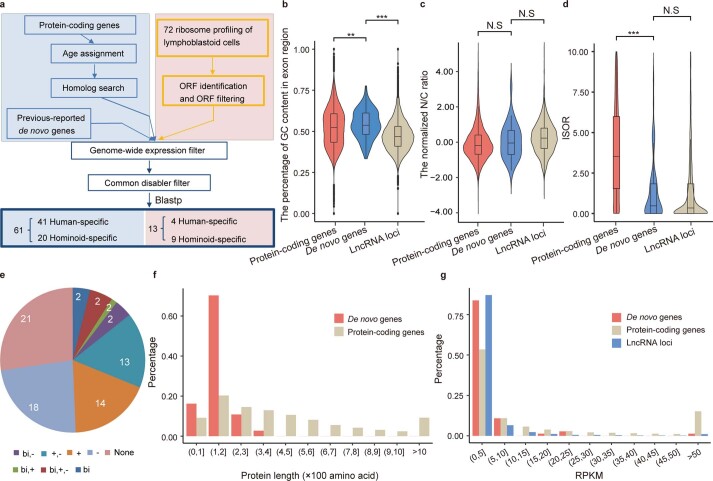
Extended Data Fig. 4. Identification of human-/hominoid-specific de novo genes.
a, Computational pipeline for de novo gene identification. (b-d) The distributions of GC content (b, n = 21,392 for protein-coding genes; n = 74 for de novo genes; n = 7,109 for lncRNA loci; one-sided, unpaired Wilcoxon test, P value = 5.5e-3 and P value < 2.2e-16, respectively), N/C ratio (c, n = 15,734 for protein-coding genes; n = 33 for de novo genes; n = 1,860 for lncRNA loci; one-sided, unpaired Wilcoxon test, P value = 0.40, 0.16, respectively), and ISOR (d, two-sided, unpaired Wilcoxon test, P value < 2.2e-16, 0.94, respectively), for de novo genes (De novo, n = 61), protein-coding genes (Protein-coding, n = 17,990) and genes encoding lncRNAs (LncRNAs, n = 2,777). The boxes represent interquartile range, with the line across the box indicates the median. The whiskers extend to the lowest and the highest value in the dataset. e, The number of de novo genes co-opting with the transcriptional context of cis-NATs (Natural Antisense Transcripts) or bi-directional promoters were summarized and shown in pieplot. bi: bi-directional promoters; +: overlapping with known genes of same strand; -: overlapping with known genes of reverse strand. Here ‘overlapping a known gene’ means coordinate overlap, rather than an overlap with a known gene in the same frame. f, The distributions of the length of proteins, for de novo genes and protein-coding genes. g, The distributions of the expression levels for de novo genes, protein-coding genes and genes encoding lncRNAs. **P value ≤ 0.01; ***P value ≤ 0.001; N.S, not significant.

