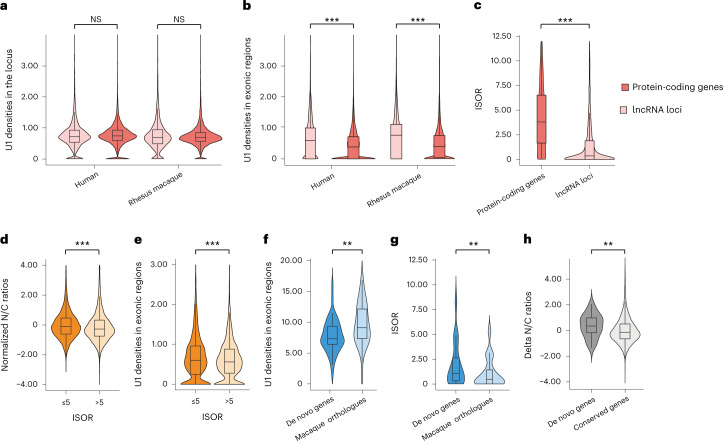
Fig. 2. Switching of key features during the origin of human de novo genes.
a,b, Box plots showing the density of strong U1 binding sites (in number of sites per kilobase) in the genic (a) and exonic regions (b) of genes encoding mRNAs and lncRNAs. n = 55,187 for human protein-coding genes; n = 2,615 for human genes encoding lncRNAs; n = 25,620 for macaque protein-coding genes; n = 616 for macaque genes encoding lncRNAs; statistics for a: one-sided, unpaired Wilcoxon test; statistics for b: one-sided, unpaired Wilcoxon test, P < 2.2 × 10⁻¹⁶ and P < 2.2 × 10⁻¹⁶, respectively. c, Distributions of ISOR scores for mRNAs and lncRNAs in the nuclear fraction of the human brain. n = 18,084 for mRNAs; n = 2,823 for lncRNAs; statistics for c: one-sided, unpaired Wilcoxon test, P < 2.2 × 10⁻¹⁶. d,e, Distributions of the normalized N/C ratio (d, n = 14,604 mRNAs; one-sided, unpaired Wilcoxon test, P < 2.2 × 10⁻¹⁶) and exonic U1 density (e, n = 14,604 mRNAs; one-sided, unpaired Wilcoxon test, P = 6.4 × 10⁻⁶) for mRNAs with different ISOR scores. f,g, Distributions of the density of all U1 binding sites (f, in number of sites per kilobase, n = 50 for de novo genes; n = 45 for their macaque orthologues encoding lncRNAs; one-sided, unpaired Wilcoxon test, P = 1.7 × 10⁻³) and ISOR scores (g, n = 19 pairs; one-sided, paired Wilcoxon test, P = 5.3 × 10⁻³), in de novo genes and their macaque orthologues encoding lncRNAs. h, Box plots showing the difference of N/C ratios between de novo genes and their macaque orthologues encoding lncRNAs in brain tissues. As we attempted to compare the de novo genes with the background, the differences of N/C ratios between orthologue pairs in macaque and human are shown. n = 32 for de novo genes; n = 12,210 for all orthologue pairs; one-sided, unpaired Wilcoxon test, P = 5.3 × 10⁻³. The boxes represent interquartile range, with the line across the box indicates the median. The whiskers extend to the lowest and the highest value in the dataset. **P ≤ 0.01; ***P ≤ 0.001; NS, not significant.

