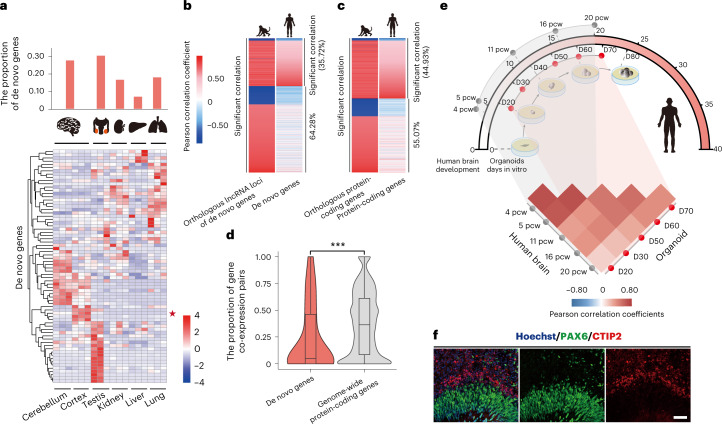
Fig. 5. Newly originated de novo genes modulate the human brain transcriptome.
a, Heat map showing the tissue expression profile of 72 de novo genes in six human tissues (brain, kidney, liver, lung and testis), with the case gene (ENSG00000205704) selected in the proof-of-concept study marked with a star. Two de novo genes (ENSG00000233290 and ENSG00000205056) not expressed in all of the six types of tissue were not included. b–d, For each macaque gene co-expressed with the macaque orthologues of human de novo genes (b, left), we investigated whether such a co-expressed gene pair is conserved in human (d, right), with the Pearson correlation coefficient between gene pairs shown in the heat maps according to the colour scales. The list of genome-wide protein-coding genes was also shown as a control (c). For each de novo gene, the proportions of the co-expressed gene pairs conserved in human and rhesus macaque were also summarized in the box plot, which were compared with those of the control (d, n = 42 for de novo genes; n = 14,226 for conserved genes between human and macaque; two-sided, paired Wilcoxon test, P = 2.8 × 10⁻⁴), The boxes represent interquartile range, with the line across the box indicating the median. The whiskers extend to the lowest and the highest value in the dataset. e, Schematic plot showing the temporal relationship between the stages of human cortical organoid culture and human foetal brain development, with the correlations of the transcriptome summarized in the heat map. The Pearson correlation coefficients between the transcriptomes of brain tissues and cortical organoids at different stages are shown in the heat map according to the scales. The dotted line highlights the comparisons between pairs of tissue/organoid at comparable developmental stages. 4–20 pcw: post-conceptional weeks 4–20 in early human brain development; D20–70: RNA-seq assays were applied to samples of at four timepoints (protocol days of human cortical organoids 20–70). f, Immunofluorescence staining of PAX6 (green) and CTIP2 (red) in Hoechst-stained (blue) organoids generated from hESCs. Scale bar, 50 μm. The experiment was repeated three times independently with similar results. ***P ≤ 0.001.

