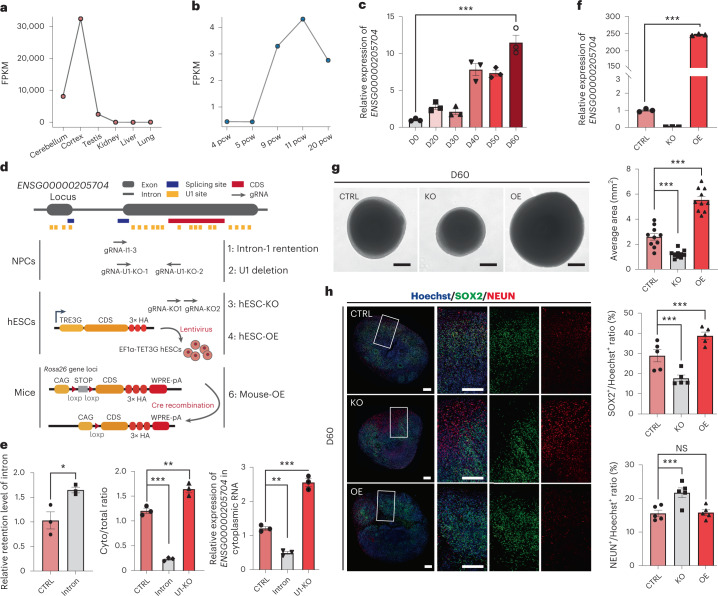
Fig. 6. A hominoid-specific de novo gene regulates neuronal maturation.
a–c, The expression profiles of ENSG00000205704 in human tissues (a, relative expression), human foetal brain at different developmental stages (b, FPKM) and human cortical organoids at different protocol days (c, relative expression, n = 3 biologically independent experiments, with a mixture of over ten organoids; data are presented as mean ± standard error of the mean (s.e.m.); two-sided, unpaired Student’s t-test, P = 5.0 × 10⁻⁴). 4–20 pcw: post-conceptional weeks 4–20 in early human brain development; D0–60: protocol days 0, 20, 30, 40, 50 and 60. d, Overview of the gene-editing studies on ENSG00000205704 in hNPCs, hESCs and transgenic mice. The CRISPR/Cas9 gRNAs were designed to target the splice site (Intron-1 retention), U1 binding sites (U1 deletion) and the coding sequence (CDS) regions (hESC-KO) of ENSG00000204705. hESCs with the over-expression of ENSG00000205704 were also developed through lentivirus transfection in hESCs (hESC-OE). Transgenic mice with ENSG00000205704-knock-in were constructed by CRISPR/Cas9 and the ectopical expression was manipulated by Cre recombination (Mouse-OE). e, Left: the effects of the disruptions of the splice site of ENSG00000205704 (Intron) on the levels of intron retention were quantified, compared with the wild type (CTRL). Middle: the nuclear export efficiencies (Cyto/total ratio: the proportion of transcripts located in cytoplasm) of ENSG00000205704 were quantified in wild-type hNPCs (CTRL), in hNPCs with the disruption of the splice site of ENSG00000205704 (Intron) and in hNPCs with six U1 binding sites on the second exon of ENSG00000205704 removed (U1-KO). Right: the expression levels of ENSG00000205704 in cytoplasm for different samples. n = 3 biologically independent experiments, data are presented as mean ± s.e.m. Left: two-sided, unpaired Student’s t-test, P = 1.5 × 10⁻³; middle: one-way ANOVA, P < 1.0 × 10⁻⁴; Dunnett’s multiple comparisons test, Intron versus CTRL P < 1.0 × 10⁻⁴, U1-KO versus CTRL P = 2.1 × 10⁻³; right: one-way ANOVA, P < 1.0 × 10⁻⁴; Dunnett’s multiple comparisons test, Intron versus CTRL P = 1.0 × 10⁻³, U1-KO versus CTRL P < 1.0 × 10⁻⁴. f, The relative expression levels of ENSG00000205704 in hESC-KO and hESC-OE organoids cultured for 60 days (n = 3, data are presented as mean ± s.e.m.; two-sided unpaired Student’s t-test, P < 1.0 × 10⁻⁴; this experiment was repeated three times independently with similar results). g, Left: brightfield images showing the size of organoids generated from hESC (CTRL), hESC-KO and hESC-OE. D60: protocol day 60. Scale bars, 500 μm. Right: quantification of the average area of organoids, according to the brightfield images, n = 10, data are presented as mean ± s.e.m.; one-way ANOVA, P < 1.0 × 10⁻⁴; Dunnett’s multiple comparisons test, KO versus CTRL P = 5.6 × 10⁻⁴, OE versus CTRL P < 1.0 × 10⁻⁴. h, Left: immunofluorescence staining of SOX2 (green) and NEUN (red) in Hoechst-stained (blue) organoids, grown for 60 days from hESCs (CTRL), hESC-KO and hESC-OE. Scale bars, 200 μm. Right: quantification of the immunofluorescence stainings. n = 5 organoids, data are presented as mean ± s.e.m.; top: one-way ANOVA, P = 1.0 × 10⁻⁴; Dunnett’s multiple comparisons test, KO versus CTRL P = 8.1 × 10⁻³, OE versus CTRL P = 1.8 × 10⁻²; bottom: one-way ANOVA, P = 3.0 × 10⁻³; Dunnett’s multiple comparisons test, KO versus CTRL P = 4.0 × 10⁻³, OE versus CTRL P = 9.9 × 10⁻¹. *P ≤ 0.05; ***P ≤ 0.001; NS, not significant.

