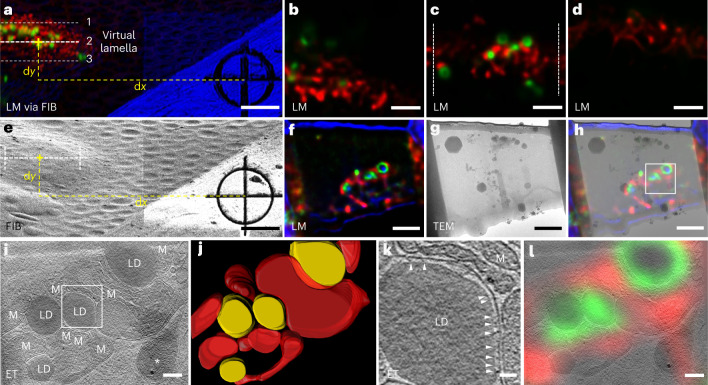
Fig. 3. LM-guided FIB milling and cryo-ET of LD–mitochondria contact sites in HepG2 cells.
a, LM via FIB of HepG2 cells grown on an EM grid, showing three milling positions of the virtual lamella as examples. The green channel shows LD–mitochondria contact sites that were genetically labeled with superfolder GFP. The red channel shows the mitochondria labeled with MitoTracker Deep Red. The blue channel shows the bright field. b–d, Computationally generated confocal images of the virtual lamellae at the three positions in a: 1 (b), 2 (c) and 3 (d). The zone between the dashed lines in position 2 was chosen for FIB milling. For the complete virtual lamellae images through the whole cell, see Supplementary Video 3. e, FIB image of the same region as in a, illustrating the determination of the milling position derived from the measured dx and dy in a. f, Confocal image of the prepared lamella, showing consistency with the virtual image in c. g, 300 kV TEM image of the prepared lamella. h, Superimposition of the LM image (f) and TEM image (g) of the prepared lamella, providing guidelines on choosing the region (boxed) for cryo-ET data collection. i, A tomographic slice of the HepG2 cell showing the LDs surrounded by mitochondria (M). An ice crystal is marked with an asterisk. j, 3D rendering of the LDs (yellow) and the mitochondrial outer membrane (red). k, Tomogram of the boxed region in i, showing the contact between an LD and a mitochondrion. Tethers at the contact site are indicated by arrows. l, Correlation between the LM image of the prepared lamella in f and the tomographic slice in i, showing the agreement between the fluorescence signal and the reconstructed structures. Five cryo-ET experiments were repeated independently with similar results. Scale bars are 5 μm in a and e; 2 μm in b–d, f–h; 200 nm in i and l and 50 nm in k.

