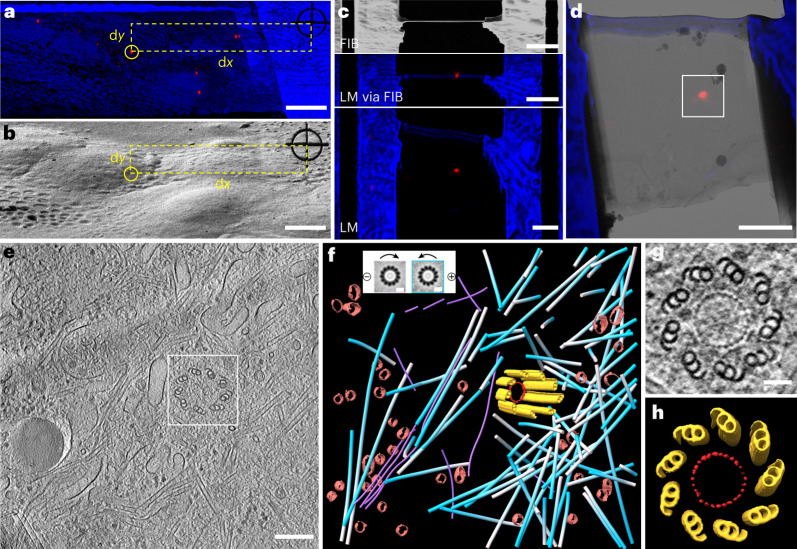
Fig. 4. LM-guided FIB milling and cryo-ET of centrosome in HeLa cells.
a, LM via FIB of HeLa cells grown on an EM grid, showing the distance measurement between a selected centrosome (circled) and the RP. The red channel shows a centrosome genetically labeled with mCherry. The blue channel shows the bright field. b, FIB micrograph of the same region as in a, illustrating the determination of the milling position according to the measured dx and dy in a. c, FIB and LM images of the prepared lamella with a thickness of roughly 200 nm, containing the targeted single centrosome. d, Superimposition of the LM and 300 kV TEM images of the prepared lamella. The boxed area was chosen for cryo-ET data collection. e, A tomographic slice showing a centriole surrounded by other cellular structures. f, 3D rendering of the centriole MTTs (yellow), ring structure in the centriole (red), surrounding microtubules (blue–white), intermediate filaments (violet) and transport vesicles (brown). Insert, the polarity determination of the microtubules, color-coded as white and blue for negative and positive orientation, respectively. g, A tomographic slices of the cross-section of the centriole in e in the top view, showing the symmetrical ninefold MTT arrangement and a ring structure with 27 evenly distributed density nodes. h, 3D rendering of the centriole in g based on STA. Three cryo-ET experiments were repeated independently with similar results. Scale bars are 10 μm in a and b; 3 μm in c and d; 200 nm in e; 10 nm in the f insert and 50 nm in g.

