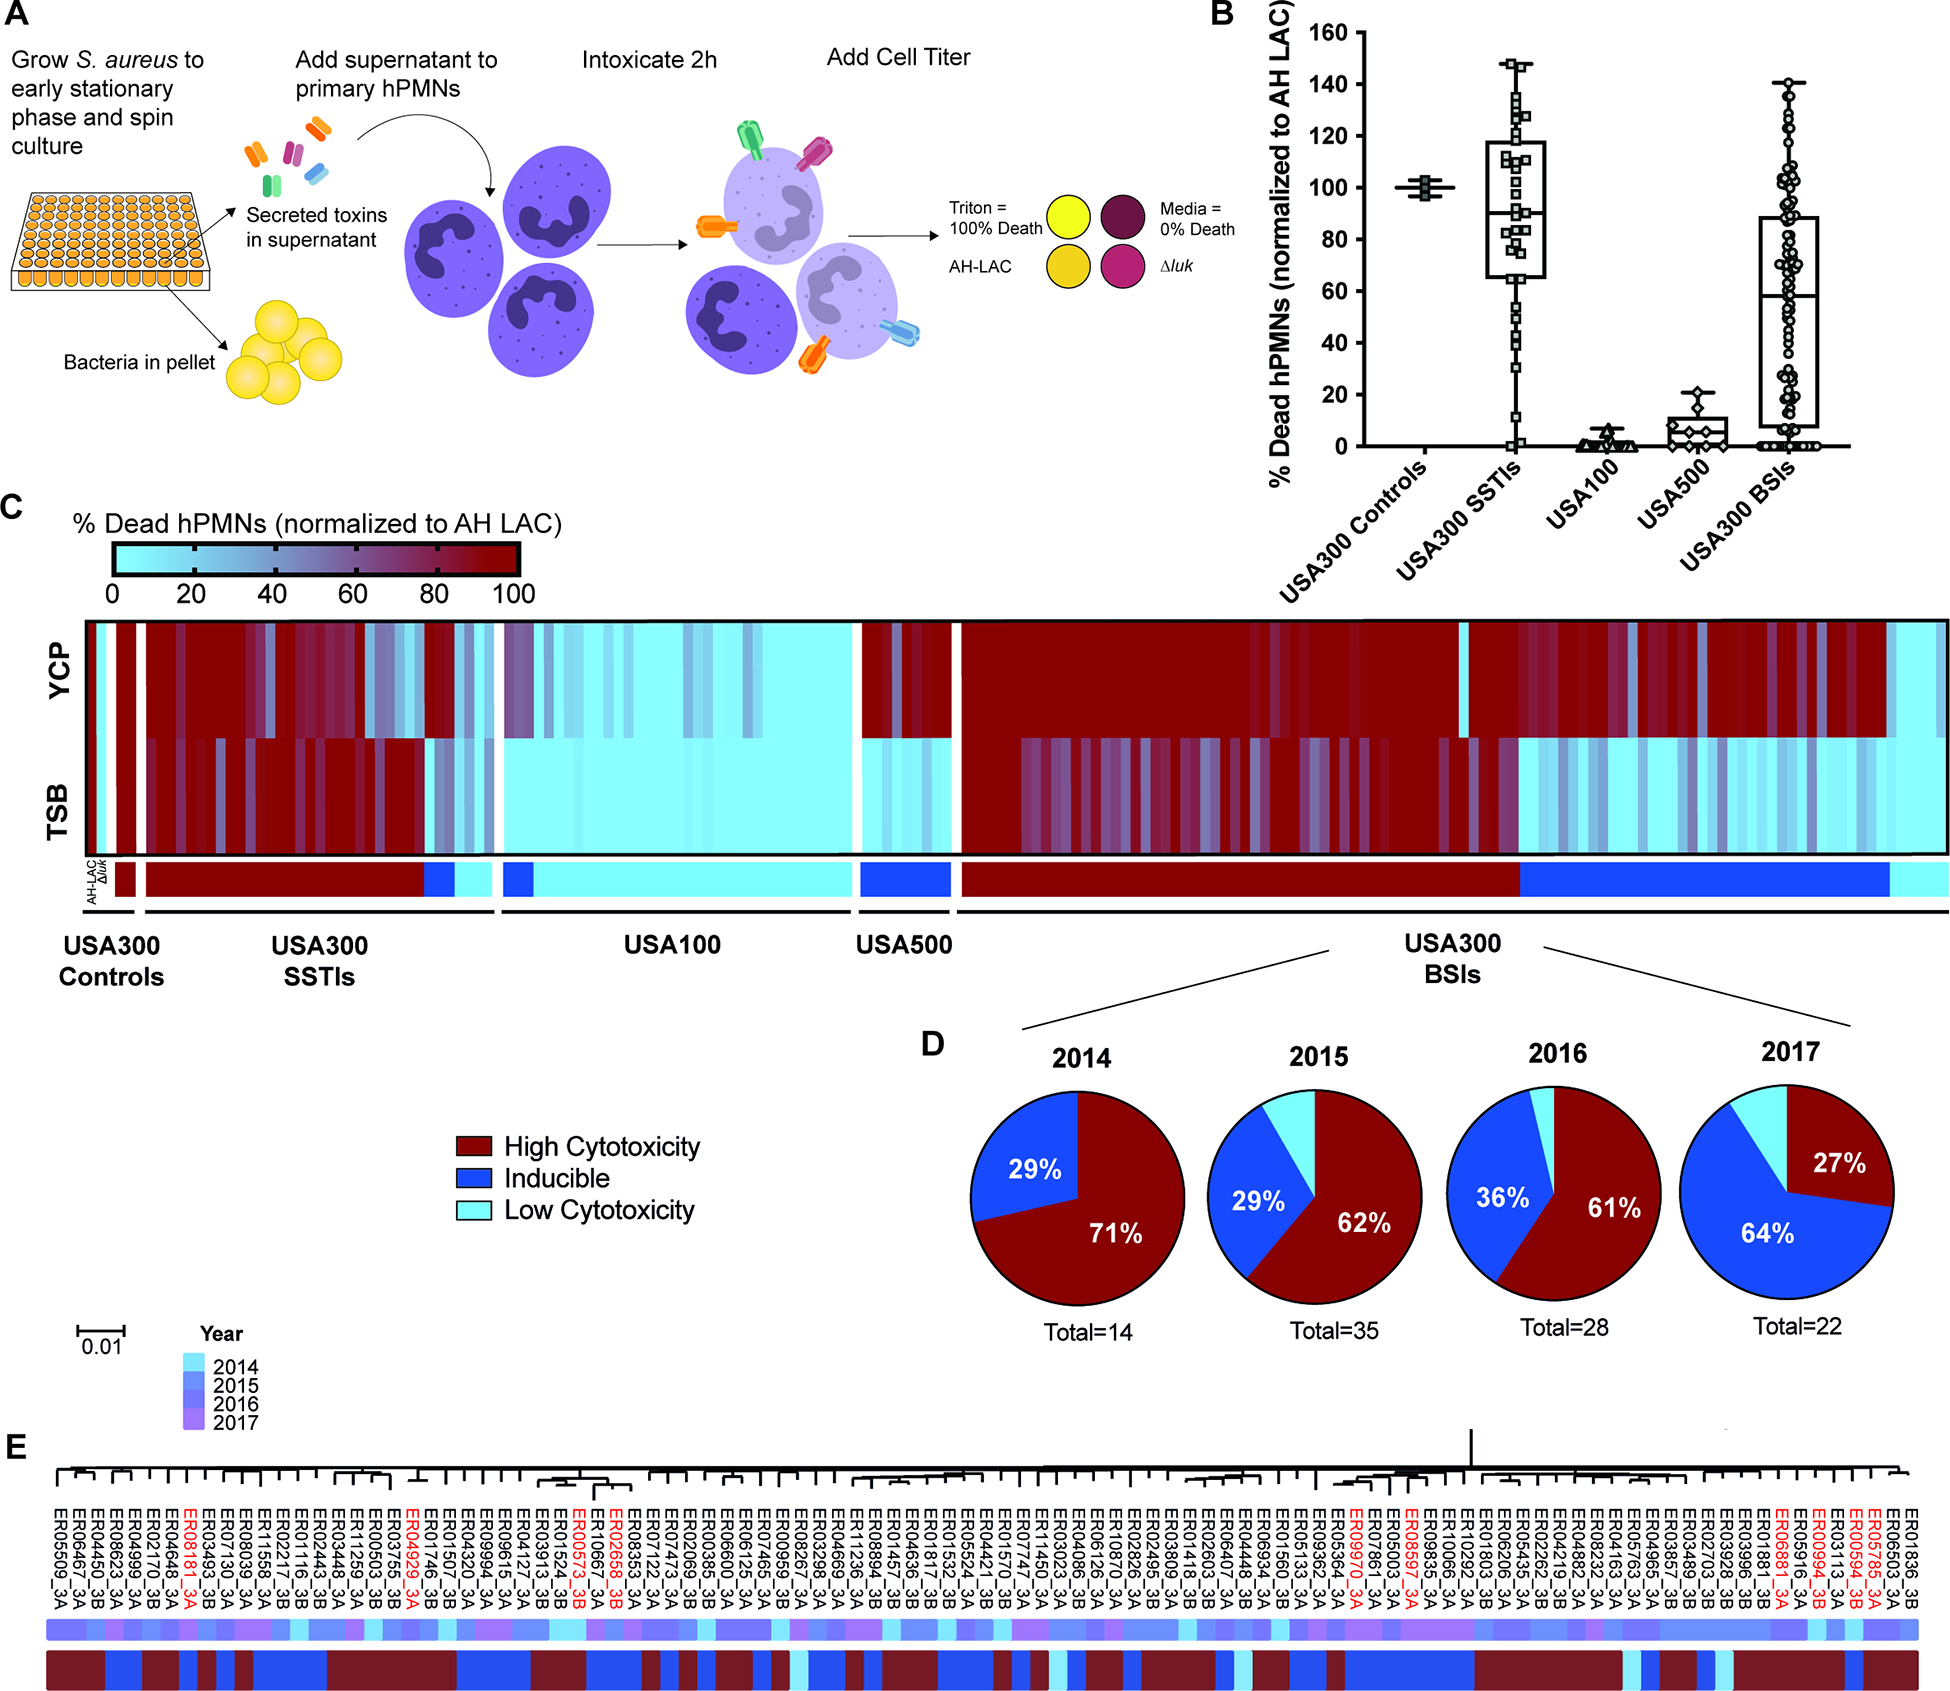
Figure 1. Phenotypic screen for cytotoxicity reveals altered virulence regulation in USA300 BSI isolates.

(A) Schematic of cytotoxicity screen. (B) Clinical S. aureus isolates grown in TSB were assessed for the ability of their supernatants to kill hPMNs. Percent death of 5% supernatants was normalized across experiments to control AH-LAC. Each point on the graph represents the mean cytotoxicity of a single isolate (n = 5–6 donors). Center line, median; box limits, upper and lower quartiles; whiskers; min and max. (C) Heat map depicting data from panel A, with the addition of 5% supernatant cytotoxicity data from bacteria grown in YCP media. Any normalized value above 100% is colored as 100%. Colored bars under heat map depict the cytotoxicity classification of each isolate: High Cytotoxicity = TSB >50%, Inducible = TSB <50% and YCP >40% increased from TSB value, Low Cytotoxicity = TSB <50% and not inducible. Strain Δluk is AH-LAC with deletion of all leukocidins59. Exact values depicted in heat map can be found in Table S2. (D) Proportions of USA300 BSI isolates classified by cytotoxicity, separated into groups by the year the isolate was collected. Total number of USA300 BSIs for each year is shown under each pie chart. (E) Maximum-likelihood phylogenetic tree produced from core genome SNVs identified from Parsnp whole-genome alignments of USA300 BSIs. Strains used for further phenotypic analysis are highlighted in red.
