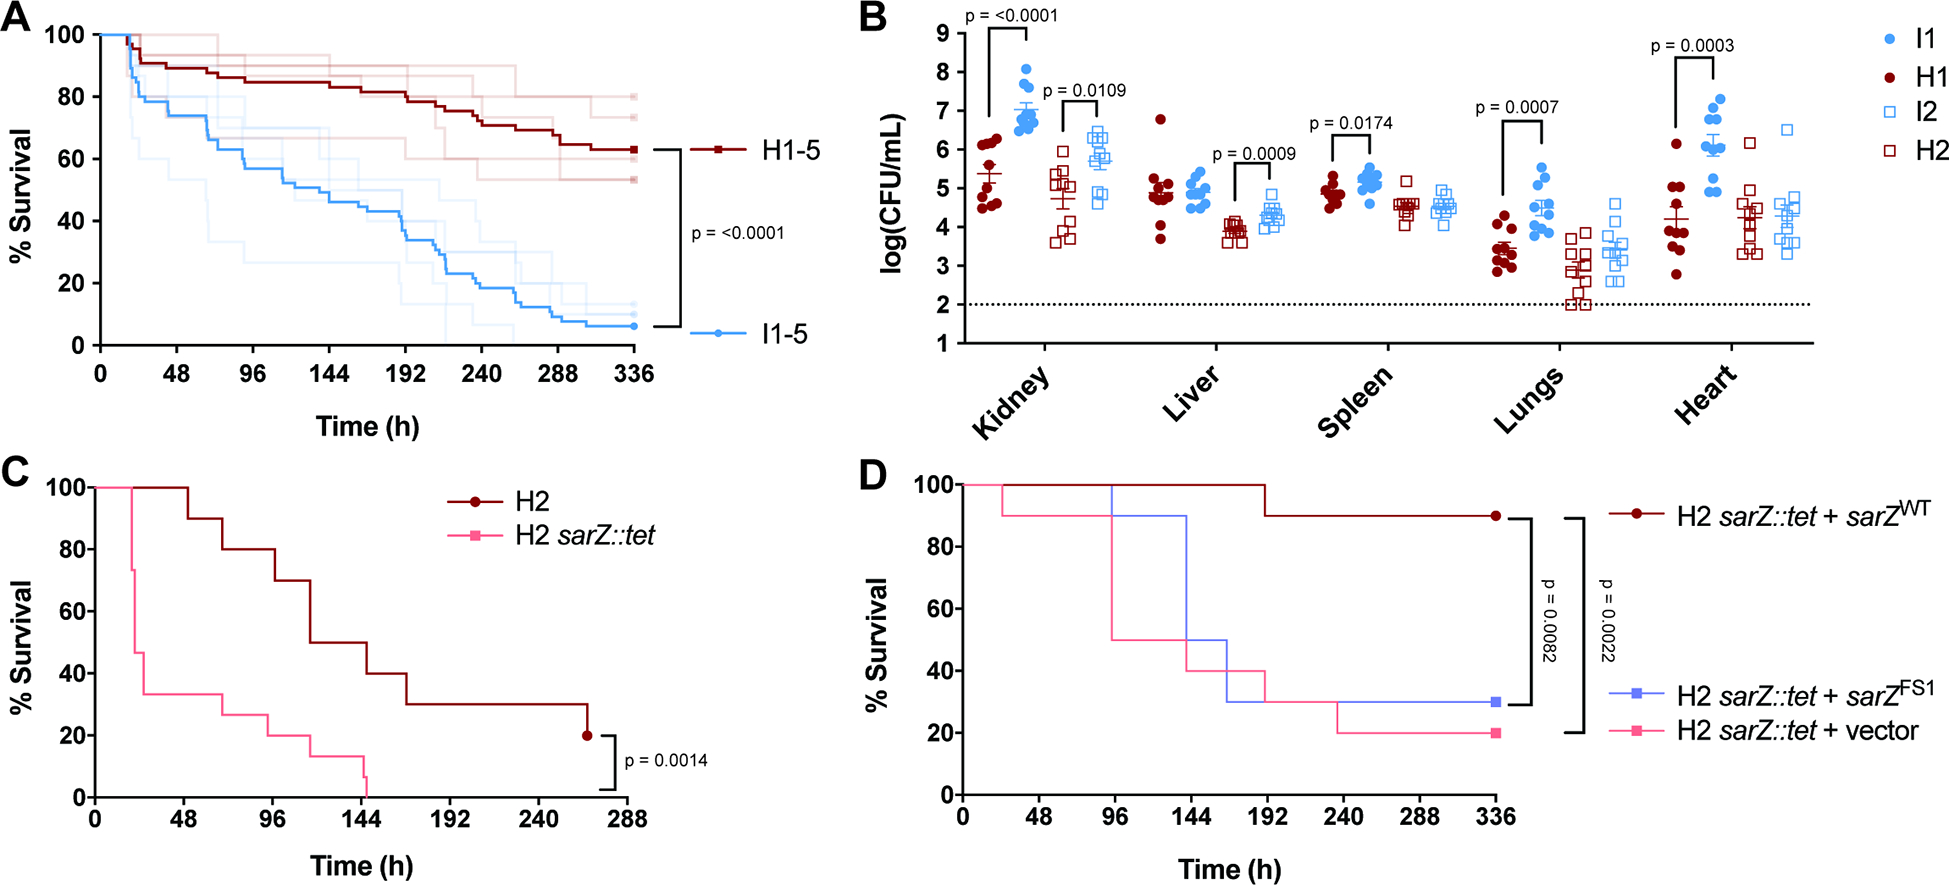
Figure 4. Increased virulence in a murine BSI model due to mutations in sarZ.

(A) Survival of mice infected i.v. (5×10⁷ CFU) with USA300 BSI isolates. Inducible USA300 (I1-I5) that have mutations in sarZ are blue. Closely related high cytotoxicity USA300 (H1–5) that have a WT sarZ locus are red. Dark lines represent pooled data for the 5 inducible isolates and for the 5 high cytotoxicity isolates (n = 65). Faded lines represent survival data for each of the 10 isolates (n = 10–15). Data shown in faded lines is also depicted in Fig. S7, separated to show differences within pairs. (B) CFU burden of mice infected i.v. (1×10⁷ CFU) with USA300 BSI isolates. Pairs 1 and 2 were used to infect mice and organs were harvested 1-day post-infection to determine CFU burden (n = 10). Statistical analysis using unpaired two-tailed t tests with Welch’s correction. (C) Survival of mice infected i.v. (7.5×10⁷ CFU) with H2 and H2 sarZ::tet (n = 10–15). (D) Survival of mice infected i.v. (8×10⁷ CFU) with H2 sarZ::tet complemented with WT and FS1 sarZ alleles (n = 10). Statistical analysis for survival curves done with the Log-rank (Mantel-Cox).
