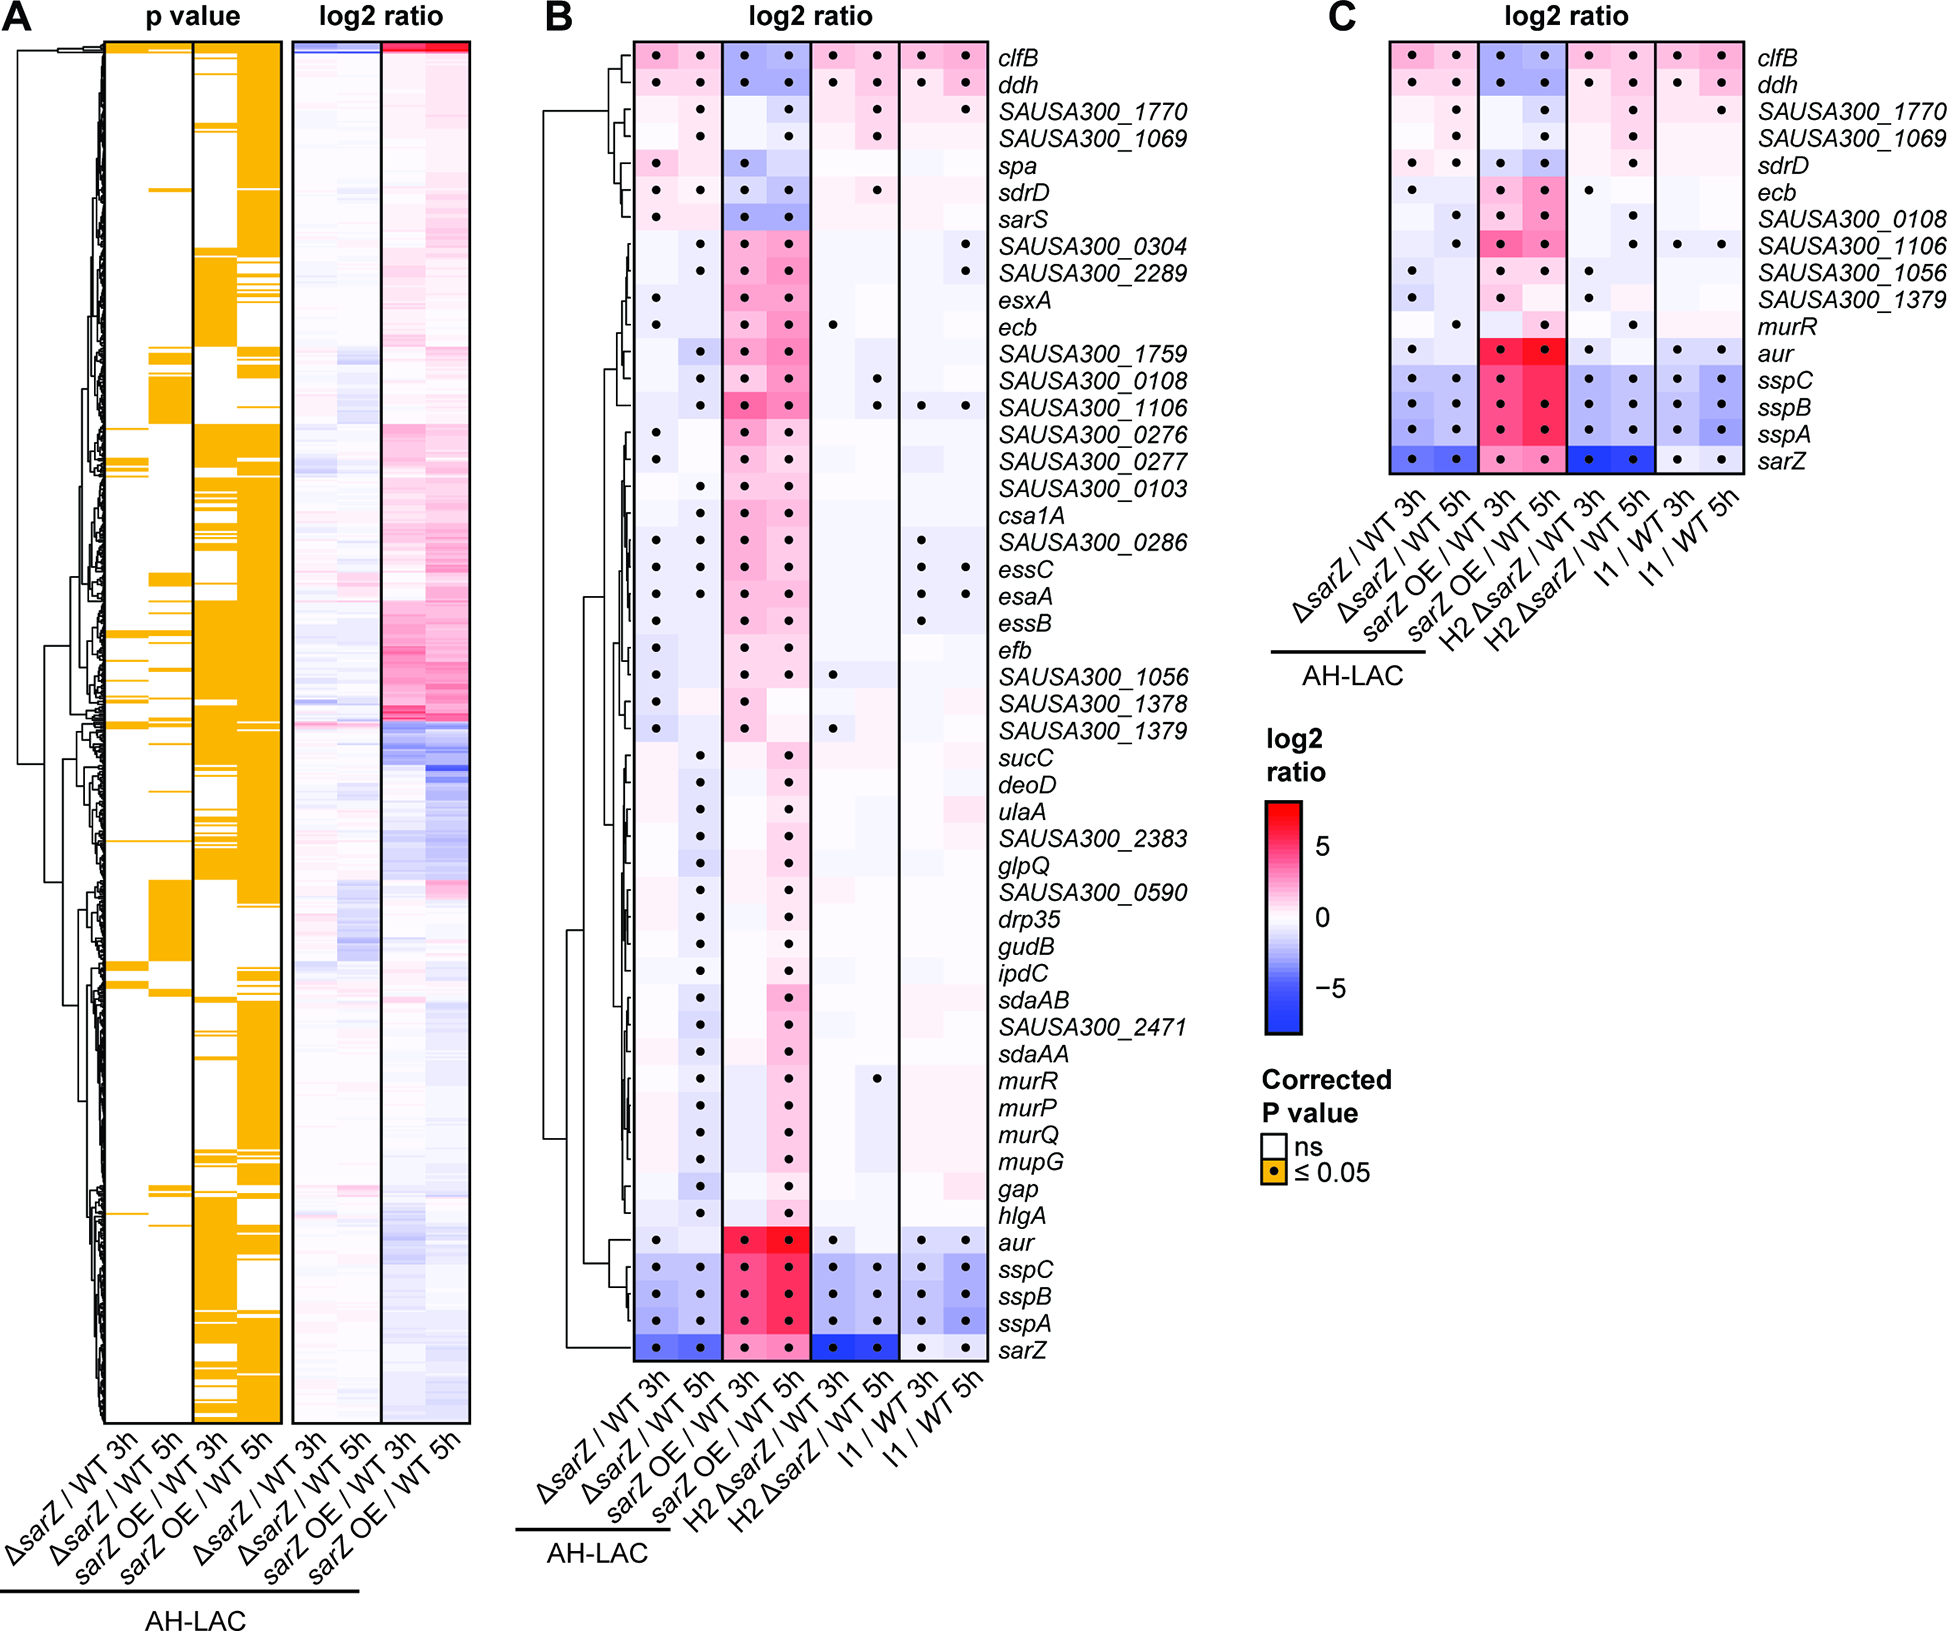
Figure 5. Characterization of the SarZ regulon in USA300.

(A) Hierarchical clustering of 696 differentially expressed genes between the AH-LAC sarZ::bursa + vector transposon mutant (ΔsarZ), or the AH-LAC sarZ::bursa + sarZWT overexpression mutant (OE), compared to wild-type AH-LAC + vector (WT) during exponential (3h) and/or or stationary (5h) growth. Columns correspond to comparisons with labels indicated at the bottom. Log2 ratio color shades and intensity represent the difference in normalized log2 counts per million (CPM), with a color key shown on the far-right. Significant expression changes (FDR q<0.05) between three replicate experiments are highlighted in yellow in the matched panel on the left. (B) Same as panel A, but focusing on the 49 genes with opposite changes between the AH-LAC sarZ deletion and overexpression experiments, and including results for the sarZ loss-of-function mutants (H2 ΔsarZ and I1) compared to their (complemented) wild-type strains for two USA300 BSI isolates. Gene names and descriptions are shown on the right, and significant changes are marked by dots. (C) Same as B, after further restricting to the 16 genes with opposite regulation between sarZ deletion and overexpression experiments in AH-LAC and USA300 BSI isolate backgrounds.
