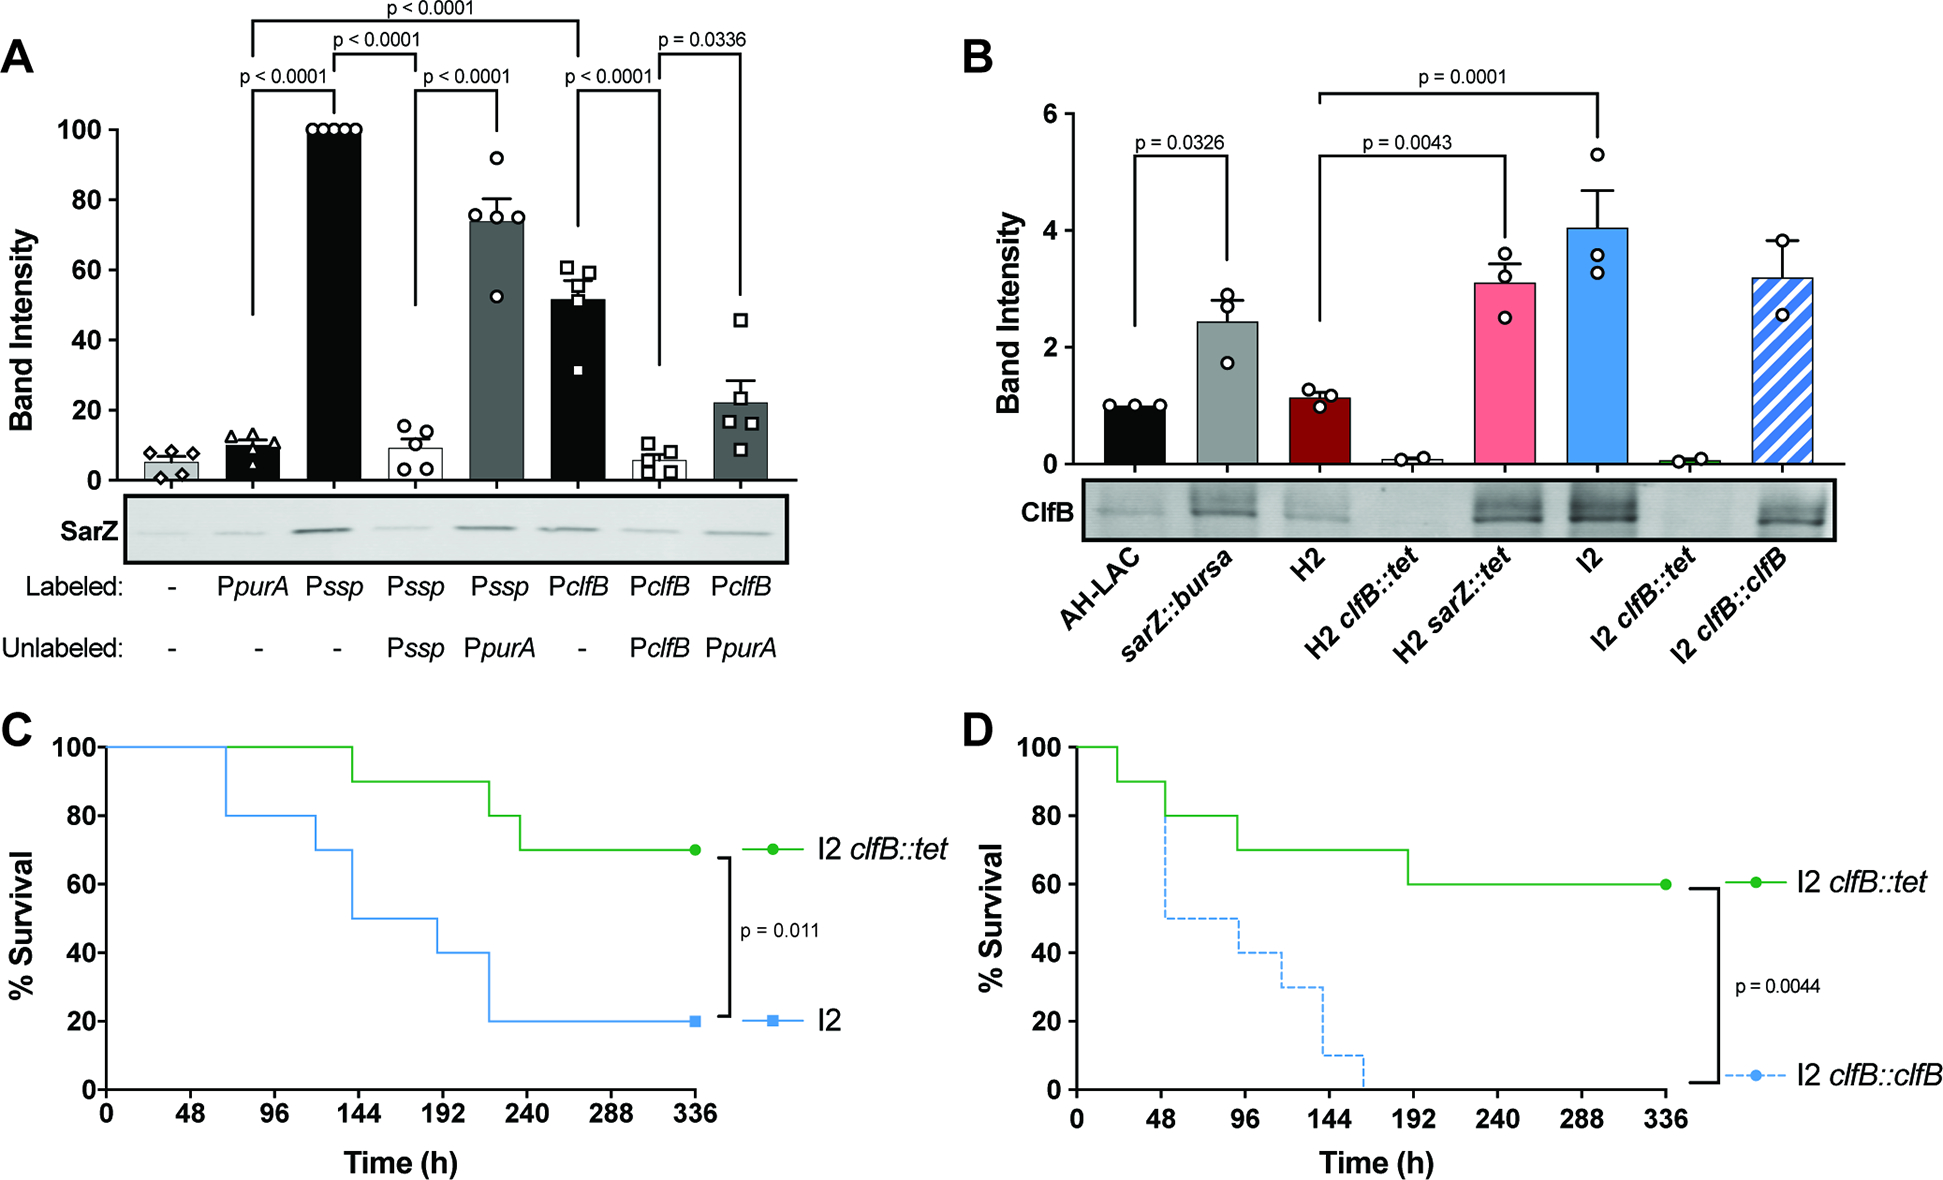
Figure 6. Increased ClfB in sarZ mutants contributes to lethality.

(A) Promoter pulldown of 50nM WT SarZ purified protein to biotinylated promoter DNA (n=5). SarZ Western blot shows one representative experiment. 15X unlabeled promoter DNA was used as a competitor. Quantification of band intensity normalized to Pssp = 100% is shown above. (B) ClfB Western blot and quantification of whole cell lysates grown 3h in TSB. Band intensity normalized to AH-LAC = 1 (n=2–3) (C) Survival of mice infected i.v. (1–2×10⁷ CFU) with I2 and I2 clfB::tet (n = 10). (D) Survival of mice infected i.v. (3×10⁷ CFU) with I2 clfB::tet and I2 clfB::clfB (n = 10). Statistical significance using a 2-way ANOVA with Sidak’s multiple comparisons test. Error bars indicate SEM. Statistical analysis for survival curves done with the Log-rank (Mantel-Cox).
