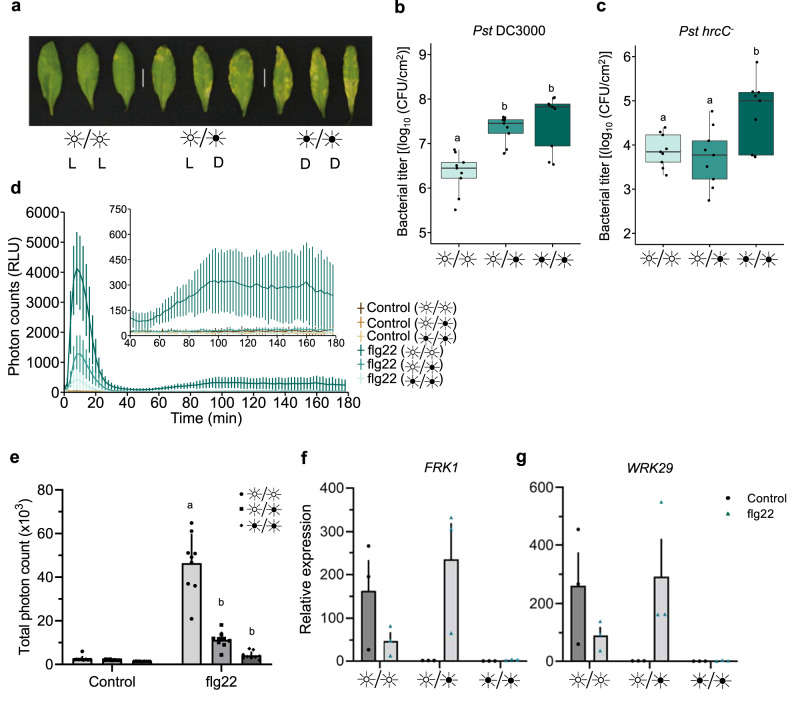
Fig. 1. Constant light confers protection against Pst.
a Disease phenotypes in Arabidopsis leaves syringe-infiltrated with Pst DC3000 (1 × 10⁵ CFU/ml). WT Plants were either kept under constant light (LL), 12 h light/dark (LD), or constant dark (DD) light cycles for 3 days after inoculation. Bacterial titers from WT leaves syringe-infiltrated with Pst DC3000 (b) or Pst hrcC − (c) at 3 days post-infection (dpi) under light regimes described in a (n = 3 biologically independent replicates). d Apoplastic oxidative burst triggered by 1 μM flg22 in WT Arabidopsis leaf punches. Leaf punches were kept in water under LL, LD or DD for 24 h prior to stimulation with flg22. Values are averages ± se (n = 27). e Total photon counts measured over 180 min from the experiments in d. Expression levels of the early PTI marker genes FRK1 (f) and WRKY29 (g) treated with 1 μM flg22 in plants that were previously placed in the indicated light settings and measured by qRT-PCR. Samples were kept under these light settings for 6 h after control or flg22 treatment after which they were harvested (n = 3 biologically independent replicates). Different letters indicate statistically significant differences, p < 0.05, ANOVA (b, c) or p < 0.0001, ANOVA followed by Tukey’s range test (e). All statistical tests are two-sided. In box plots, box edges delineate lower and upper quartiles, the center line represents the median, and whiskers extend to 1.5 times the interquartile range (IQR). In non-box-plot graphs, boxes and error bars represent mean ± S.E.M.

