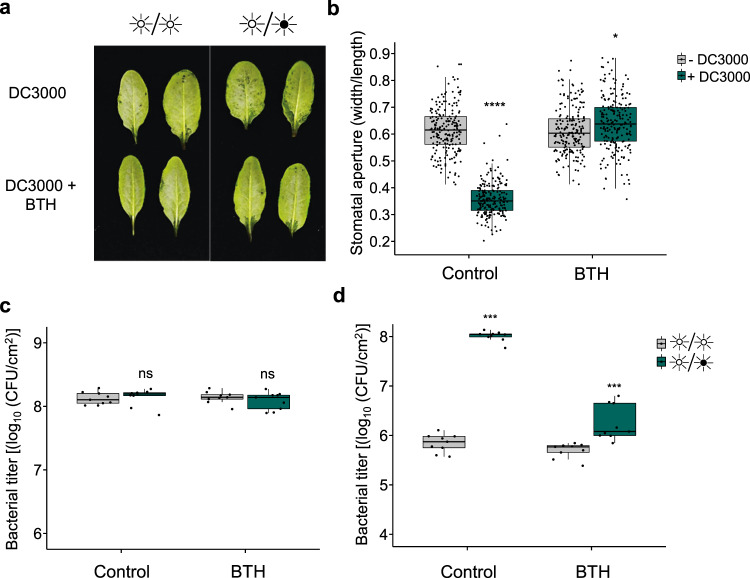
Fig. 4. BTH provides protection against bacterial induction of water-soaking.
a Water-soaking phenotypes in WT Arabidopsis infiltrated with DMSO (0.1%) or BTH (50 μM) prior to syringe-infiltration with Pst DC3000 (1 × 10⁸ CFU/ml) 24 h later. Photos were taken 24 h post-infection. b Stomatal aperture in WT Arabidopsis treated as in a and in which MgCl2 (10 mM; −DC3000) or Pst (1 × 10⁸ CFU/ml; +DC3000) was syringe-filtrated. Plants were left under light/dark conditions and stomatal apertures assessed at 24 h post infiltration (hpi) (n = 202 stomata for all conditions). c Bacterial titers from plants treated in a measured 24 hpi (n = 3 biologically independent replicates). d Bacterial titers from Arabidopsis leaves that were infiltrated with DMSO (0.1%) or BTH (50 μM) 24 h prior to being challenged with Pst DC3000 (1 × 10⁵ CFU/ml). Plants were placed under the indicated light conditions after infection. Bacterial titers were assessed at 3 days post-infection and plants were kept under the indicated light conditions throughout the infection process (n = 3 biologically independent replicates). Asterisks indicate statistically significant differences compared to control, ns non-significant, *p = 0.001, ***p < 0.0001, ****p < 2.2 × 10⁻¹⁶, Student’s t test (b for Control, c) or Wilcoxon–Mann–Whitney test (b for BTH, d). All statistical tests are two-sided. In box plots, box edges delineate lower and upper quartiles, the center line represents the median, and whiskers extend to 1.5 times the interquartile range (IQR).

