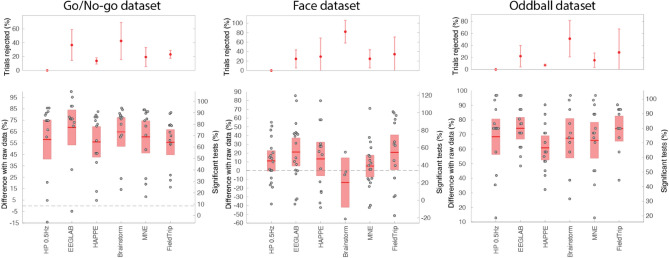
Figure 5.
Different automated pipeline percentage of significant channels compared to unprocessed raw data for three datasets. The upper panels show the percentage of trials rejected and the standard deviation. The lower panels show the percentage of significant channels compared to unprocessed raw data. The red regions indicate the 95% CI, and the dots indicate individual subjects. See Fig. 2 for details regarding the ordinate scales.

