Figure 1.
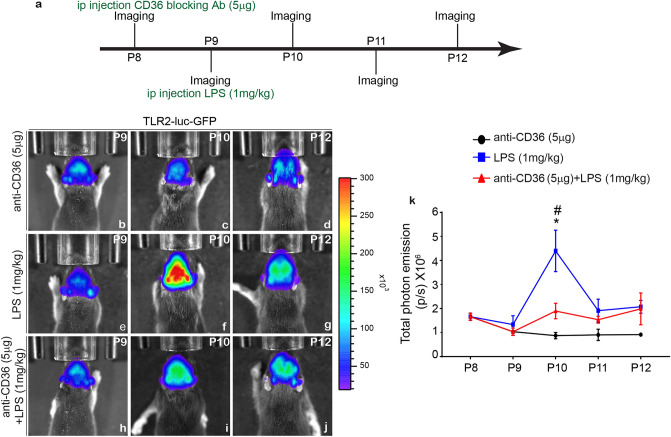
Real-time bioluminescence imaging of theTLR2 signals after LPS challenge. (a) Schematic presentation of experimental protocol used for the treatment with anti-CD36 antibodies in P8-P9 mice. (b–j) Representative images of the bioluminescent signals recorded from the brains of living P10–P12 TLR2-luc-GFP mice treated with anti-CD36 antibody (b–d), LPS (e–g) or pre-treated with anti-CD36 antibody followed by systemic LPS injection (h–j). Note that a robust TLR2 induction 24 h post-LPS treatment is significantly reduced when the pups are pre-treated with anti-CD36. The scales on the right are the colour maps for source intensity. The scale ranges differ at individual ages. (k) Quantification of the in vivo bioluminescence data from P8–P12 (in photons per second, p/s). One way ANOVA (anti-CD36 vs LPS *p ≤ 0.05, LPS vs anti-CD36 + LPS *p ≤ 0.05).

