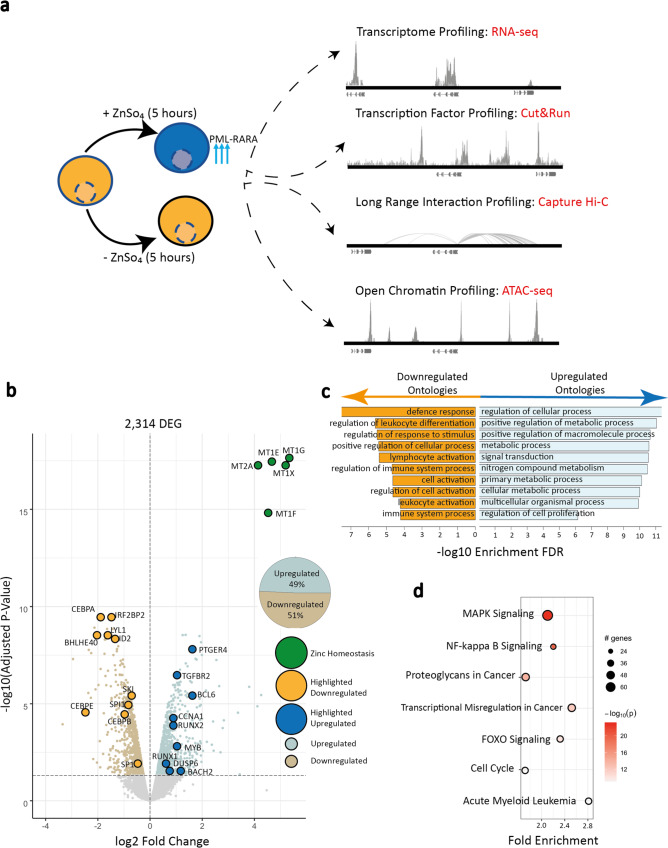
Fig. 1. PML::RARA induction instigates expression changes for thousands of genes.
a Schematic depicting the cell line model and datasets collected in this study. U937-PR9 cells (gold) have a zinc inducible promoter at a PML::RARA fusion gene, addition of ZnSO4 to these cells for five hours leads to high expression of PML::RARA (light blue cell). For each induced and uninduced experiment, RNA-seq, Cut&Run, Capture Hi-C, and ATAC-seq libraries were made. b Volcano plot displaying the 2314 significantly DEGs, based on an FDR adjusted p-value cut off < = 0.05, showing downregulated (gold) and upregulated (blue) genes. Genes implicated in zinc homeostasis are shown (green). Numbers of upregulated and downregulated genes are shown in the inset pie chart. Significant DEGs were determined using Limma’s linear modeling. c Bar plot showing the gene ontology enrichment of the up (blue) and down (gold) regulated genes. Higher −log10 enrichment scores indicate greater ontology enrichments. d Pathway enrichment of all DEGs. The size of the dot represents the number of genes within the given pathway, and the shade of red represents the significance of the DEG enrichment for the given pathway (–log10 enrichment p value determined by pathfindR internal algorithm and adjusted using Bonferroni correction). DEG = Differentially Expressed Gene. Source data are provided as a Source data file.

