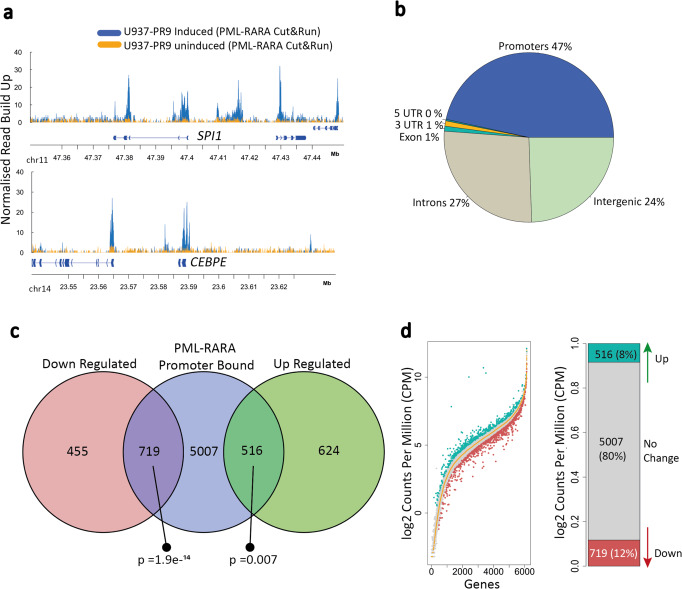
Fig. 2. Varying transcriptional responses of genes whose promoters bind PML::RARA.
a Genomic tracks of PML::RARA binding profiles at two key myeloid genes: SPI1 (top) and CEBPE (bottom). Normalized PML::RARA read density in uninduced (orange) and induced (blue) U937-PR9 cells are shown. Blue indicates the replicate #1 PML::RARA induced profile and gold indicates the replicate #1 PML::RARA uninduced (background) profile. Y-axis represents the read count normalized by library size. The genomic coordinates are indicated along the x-axis. Gene bodies and exons are indicated by connecting blue blocks. b Pie chart showing the genomic distributions of all 15,412 PML::RARA peaks within promoters = blue, intergenic regions = light green, intronic regions = gray, exons = green and 3’ untranslated regions (3’ UTR) = orange. c Venn diagram overlapping the 6242 PML::RARA-promoter bound genes (blue) with upregulated (green) and downregulated (red) genes. The significance of each overlap is represented as the p-value using a χ2 test. d Ranked plot showing the expression level distribution of all 6242 PML::RARA-bound genes in the PML::RARA-induced U937-PR9 cells, as compared to uninduced expression. Genes are ordered according to their expression level in uninduced cells. The expression of each gene in the uninduced cells is represented by the central orange line. The PML::RARA-induced expression of each gene is indicated by green, gray, and red dots indicating upregulation, no expressional change, and downregulation, respectively. Expressional change is based on genes having an adjusted p-value < = 0.05. The side bar plot shows the proportion of PML::RARA-bound genes that are upregulated, have no expressional change or downregulated. Source data are provided as a Source data file.

