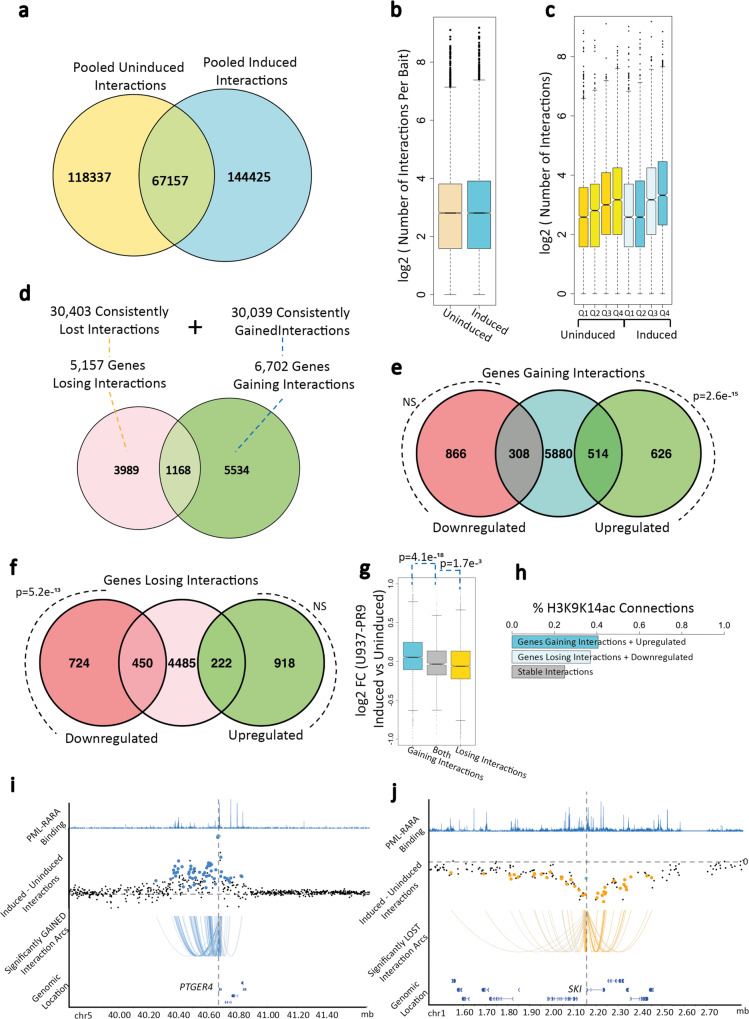
Fig. 3. Gains and losses of long-range interactions upon PML::RARA induction.
a Overlap of significant (CHiCAGO score>5) interactions identified in PML::RARA-induced (cyan) and uninduced (orange) U937-PR9 cells. b The number of significant interactions per baited promoter across uninduced (orange) and PML::RARA induced (cyan) interactions (from three biological replicates across 19,023 genes). Y-axis is log2 scale. c The number of significant interactions per gene (from three biological replicates across 19,023 genes), separated into expression quartiles. Q1 = genes with log2CPM < −5.12, Q2 = genes with log2CPM expression ranging from −5.12 to 1.7, Q3 = genes with log2CPM expression ranging from 1.7 to 5.3, Q4 = genes with log2CPM expression >5.3. The first four boxes refer to interactions and expression levels in the uninduced cells (orange) and the second four boxes refer to those in PML::RARA-induced cells (blue). d Overlap of genes that gain interactions (green) and genes that lose interactions (pink). e Overlap of genes that gain interactions (teal) and genes whose expression is significantly increased (green) or decreased (red). P refers to the significance of the overlap as determined by χ2 test. NS = not significant. f Overlap of genes that lose interactions (pink) and genes whose expression is significantly increased (green) or decreased (red). P refers to the significance of the overlap as determined by χ2 test. NS = not significant. g Log2 fold expression change of induced vs uninduced cells for genes that exclusively gain interactions (cyan), both gain and lose interactions (gray), and exclusively lose interactions (orange). p represents the two-sided t-test p-value comparing the mean expression levels of the different categories. N = two RNA-seq biological replicates. h Percentage of interacting non-promoter ends that overlap with H3K9/K14ac ChIP-seq peaks. i PML::RARA binding sites and gained interaction profiles at the PTGER4 gene, which is upregulated upon PML::RARA induction. The top row shows the genes and their genomic coordinates. Second panel shows the PML::RARA binding profile. Third panel shows capture Hi-C interaction read count difference of induced vs uninduced cells. Each dot represents a HindIII fragment. Enlarged dots indicate that the HindIII fragment has a significantly greater number of reads in the PML::RARA induced sample and is considered a gained interaction. The fourth panel shows an arc plot, connecting the PTGER4 gene with all HindIII fragments with significantly differential interactions. j Similar landscape plot as (i) but representing the SKI gene locus which loses interactions and is downregulated, indicated by orange. All boxplots were plotted with identical parameters: minima and maxima are indicated either as the lowest and highest outliers or as the lower and upper whiskers if the values are within −1.5 and 1.5x the interquartile range from the lower and upper quartiles, respectively. The box bounds correspond to the first and third quartiles. The center indicates the median—all outliers are plotted. Source data are provided as a Source data file.

