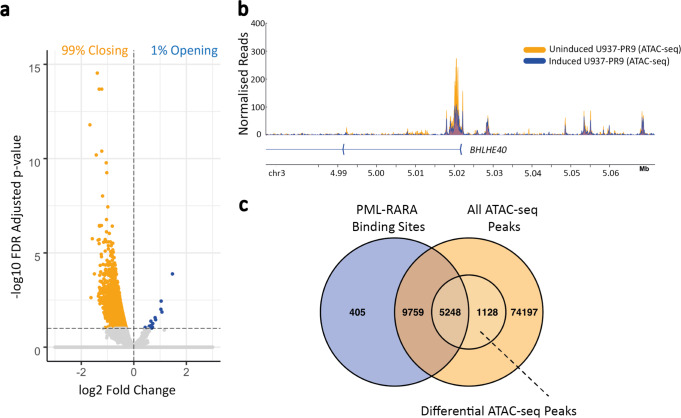
Fig. 4. PML::RARA expression induces widespread reduction of open chromatin regions.
a Volcano plot showing the differential ATAC-seq peaks comparing PML::RARA-induced cells to uninduced cells. Each dot represents an ATAC-seq peak. Peaks significantly reduced in size are colored orange and significantly increasing in size are blue. Significance threshold is adjusted p-value < = 0.1. b Landscape plot showing an example of a differential ‘closing’ ATAC-seq peak at the BHLHE40 promoter. ATAC read coverage profile in uninduced (orange) and induced (blue) replicate #1 samples are shown. Reads are normalized by library size. c Venn diagram showing overlap of the 15,412 PML::RARA binding sites with the 90,322 ATAC-seq peaks and the subset of 6376 closing ATAC-seq peaks. Source data are provided as a Source data file.

