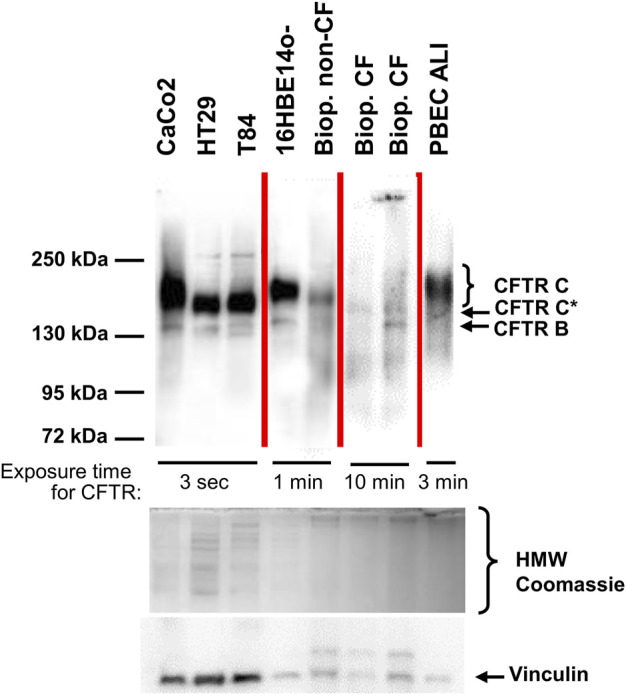
FIGURE 1.

CFTR immunoblot analyses of epithelial cell lines, primary bronchial epithelium and from rectal biopsies from one healthy control and two CF samples. CFTR signals were obtained from the intestinal cancer cell lines CaCo2, HT29, T84, from the immortalized respiratory epithelial cell line 16HBE14o-, from primary peripheral bronchial epithelium (PBEC) generated by air-liquid interface (ALI) culture and compared to a rectal suction biopsy derived from a non-CF control (“Biop. non-CF”) and from two CF rectal suction biopsies (“Biop. CF”). Western blots reveal a narrow band B at 130 kDa and a much broader band C between 150 and 180 kDa in all samples except for the CF patients’ biopsies. Rectal biopsies from CF patients showed a band B similar to the other samples and generated a narrow signal, migrating slower than band B at approximately 140 kDa designated as CFTR C*. A poly-disperse wild-type band C visible in all other non-CF samples was absent from CF biopsies. Samples were loaded on one gel, yet this figure is a composite as visualization of signals was done using exposure times between 3 s and 10 min for CFTR as noted within the figure. Source data of all four exposures of the entire membrane is provided in the supplement. Protein amount loaded was as follows: CaCo2, HT29, T84, 16HBE14o-: 30 μg; PBEC ALI: 25 μg; rectal suction biopsies: 75 µg.
