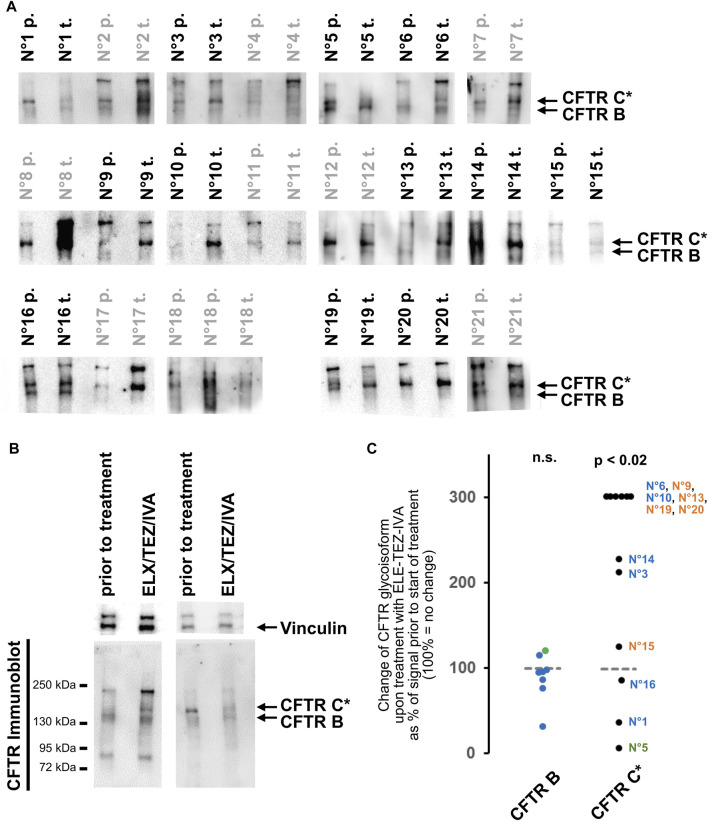
FIGURE 2.
Changes in CFTR glycoisoforms from rectal suction biopsies prior to and after initiation of treatment with ELX/TEZ/IVA. (A) CFTR immunoblot signals of rectal biopsy lysate pairs from 21 patients. Samples prior-to-treatment (labelled “p.”) and samples obtained after ELX/TEZ/IVA treatment (labelled “t.”) were incomparable as judged by Coomassie staining and by vinculin detection for these eight pairs: N°2, N°7, N°8, N°11, N°12, N°17, N°18, N°21 (labelled in grey; see methods section for details on censoring). Exposures are selected to visualize band C* and B in CF samples. Calibration of C* vs. CFTR-C from 16HBE14o- is shown as source data of the entire patient cohort including Coomassie staining of high molecular weight proteins and vinculin signals in Supplementary Figure S2. (B) Western blot of two representative examples. Left sample pair shows an increase of CFTR C* upon treatment with ELX/TEZ/IVA (patient N°6) while right sample pair shows a decrease of CFTR* upon treatment with TEZ-ELE-IVA (patient N°1). Additionally, the left sample pair shows the <95 kDa and 240 kDa immune-reactive signals visible in about a third (<95 kDa) and all but one (240 kDa) samples. (C) Densitometry was carried out on side-by-side loaded lanes of pre- and post-treatment samples for 12 out of 21 biopsy lysate pairs that yielded comparable signals for whole protein content and vinculin [see Panel (A) and Section 2 for details on censoring]. An increase of CFTR C* is observed (p < 0.02, Wilcoxon signed rank test) while the signal intensity of the core glycosylated band B is unaltered by ELX/TEZ/IVA. The patient’s CFTR mutation genotype is color-coded as follows: p.Phe508del homozygotes—terracotta (N°15, N°19, N°20, N°13, N°9); p.Phe508del compound heterozygotes with a class I mutation—blue (N°1, N°16, N°3, N°14, N°10, N°6); p.Phe508del/N1303K compound heterozygote—green (N°5).

