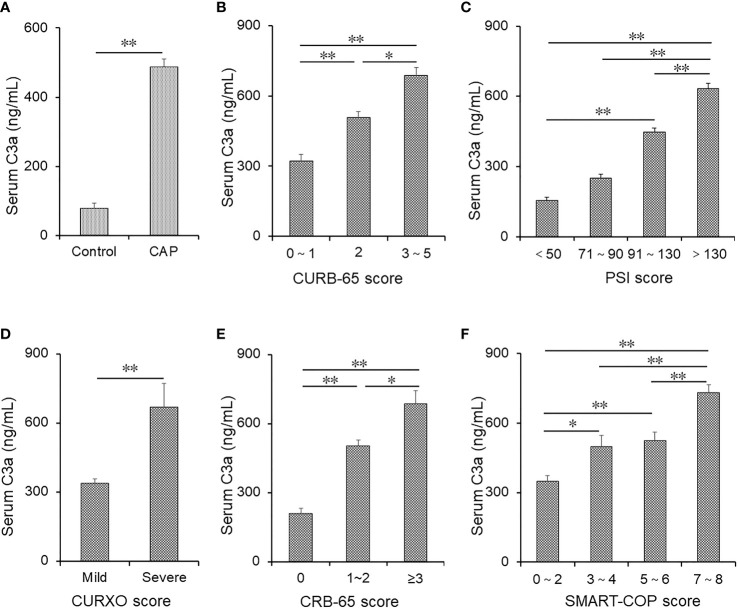
Figure 1.
The levels of serum C3a in patients with CAP and control subjects. (A–F) Serum C3a was detected using ELISA in CAP patients and control subjects. (A) The levels of serum C3a were compared between control subjects (n = 95) and CAP patients (n = 190). (B) The levels of serum C3a were measured in patients with different CURB scores (score of 0–1: n = 95; score of 2: n = 56; score of 3–5: n = 48). (C) The levels of serum C3a were measured in patients with different PSI scores (score of <50: n = 34; score of 71–90: n = 22; score of 91–130: n = 32; score of >130: n = 102). (D) The levels of serum C3a were compared in patients with different CURXO scores (mild: n = 112; severe: n = 78). (E) The levels of serum C3a were compared in patients with different CRB-65 scores (score of 0: n = 44; score of 1–2: n = 108; score of ≥3: n = 38). (F) The levels of serum C3a were compared in patients with different SMART-COP scores (score of 0–2: n = 81; score of 3–4: n = 51; score of 5–6: n = 24; score of 7–8: n = 34). Data were expressed as the mean ± SEM. The statistical difference was analyzed by ANOVA or Student’s t-tests. *p < 0.05, **p < 0.01.

