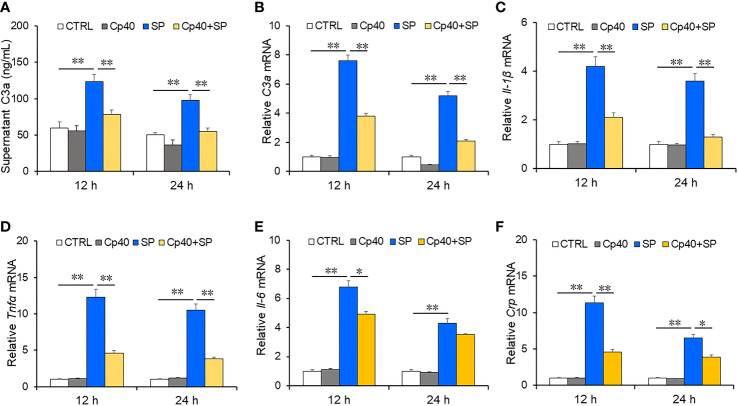
Figure 3.
The levels of complement C3a and inflammatory cytokines in MLE-12 cells after SP infection. In the Cp40 and Cp40+SP groups, MLE-12 cells were pre-incubated with Cp40 (200 µM) at 24 h and 48 h before SP exposure. Then, MLE-12 cells were exposed with SP (107 CFU/ml) in SP and Cp40+SP groups. In the control group, MLE-12 cells were co-cultured with DMSO. Lastly, supernatant and cells were collected at 12 h and 24 h after SP exposure. The expressions of C3a and inflammatory cytokines were measured in MLE-12 cells. (A) The level of supernatant complement C3a was measured at 12 and 24 h after SP injection in MLE-12 cells through ELISA. (A) C3a. (B) The level of complement C3a mRNA was measured through RT-PCR at 12 and 24 h after SP infection in MLE-12 cells. (B) C3a mRNA. (C–F) The levels of inflammatory cytokine mRNAs were measured through RT-PCR at 12 and 24 h after SP injection in MLE-12 cells. (C) IL-1β mRNA; (D) TNF-α mRNA; (E) IL-6 mRNA; (F) Crp mRNA. All data were expressed as mean ± SEM of six samples (n = 6). The statistical difference was analyzed by ANOVA method. *p < 0.05, **p < 0.01.

