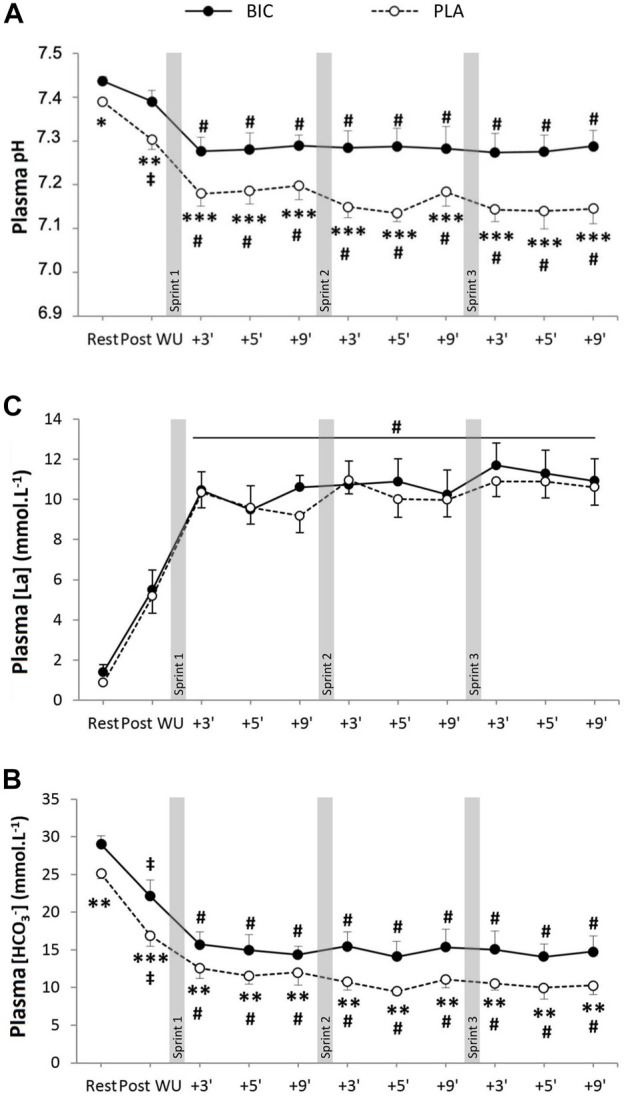
FIGURE 2.

(A) Blood pH, (B) bicarbonate concentration ([HCO3−]), and (C) lactate concentration ([La−]) during the repeated sprints after either BIC (solid line) or PLA (dashed line) supplementation (n = 8). *, **, *** denote significant differences from PLA (p < 0.05, p < 0.01 and p < 0.001, respectively); # denotes significant difference from post warm-up (p < 0.001); ‡denotes significant differences from rest (p < 0.05).
