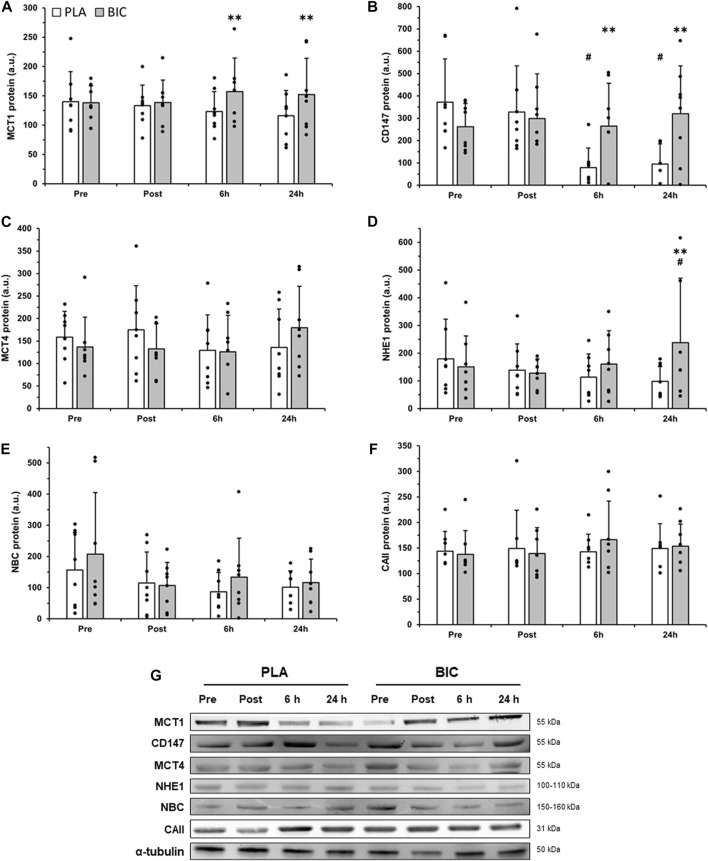
FIGURE 3.
Comparison of (A) MCT1, (B) CD147, (C) MCT4, (D) NHE1, (E) NBC, and (F) CAII protein abundance in the vastus lateralis between the PLA (white bars) and BIC (grey bars) conditions. Values are normalized to the α-tubulin loading control and expressed in arbitrary units. All values are mean ± SD (n = 8). (G) Representative western blots for each protein. α-tubulin served as a loading control, and a biopsy from a single participant who did not complete the intervention served as a positive control. **Denotes significant differences from PLA (p < 0.01), # denotes significant differences from rest (p < 0.01).

