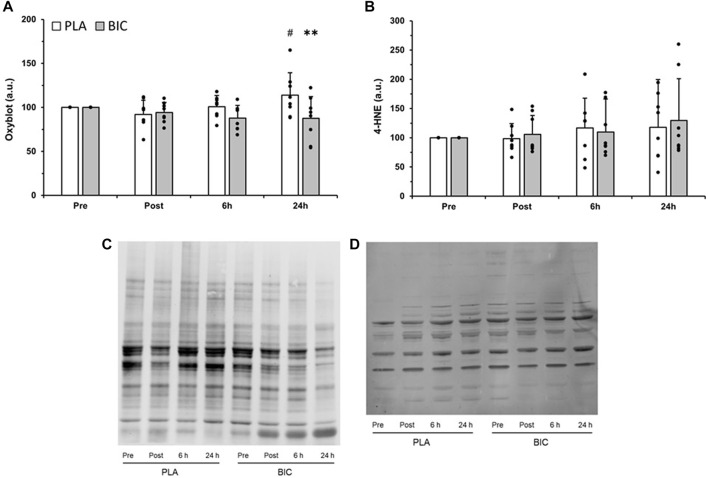
FIGURE 6.
Comparison of (A) protein carbonylation as measured by oxyblot, and (B) lipid peroxidation, as measured by 4-hydoxy-2-nonenal (4-HNE), in the vastus lateralis between the PLA (white bars) and BIC (grey bars) conditions. All values are mean ± SD (n = 8). Individual data is shown in black points. **Denotes significant differences from PLA (p < 0.01), #denotes significant differences from rest (p < 0.01). Representative blots for (C) oxyblot and (D) 4-HNE are shown.

