Figure 2.
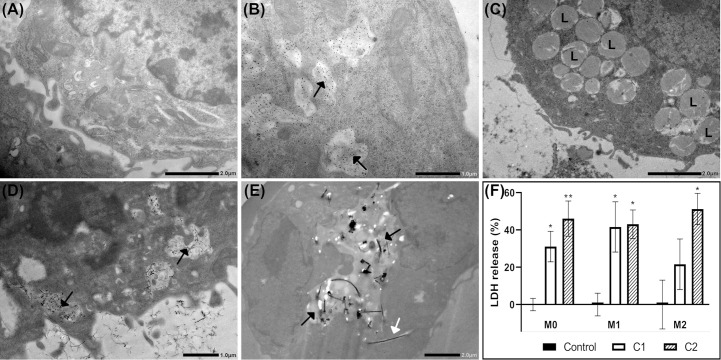
Cellular uptake and effects on membrane permeability at 24h post-exposure. Uptake of nanomaterials was investigated by TEM or immuno-TEM in M1 macrophages. Representative images of (A) Control, (B) CNC, (C) CNF, (D) NM-400, and (E) NM-401-exposed cells. C1: 0.15 μg/cm2 and C2: 2.7 μg/cm2. The experiment was repeated twice. Black arrows indicate endosomal structures with nanomaterials. White arrows indicate fibers in cell cytoplasm. L indicates lysosomal structures. (F) Membrane leakage as measured by medium lactate dehydrogenase (LDH) release following NM-401 exposure. Data indicate mean ± SD, (n=3-5), *p<0.05, **p<0.01.

