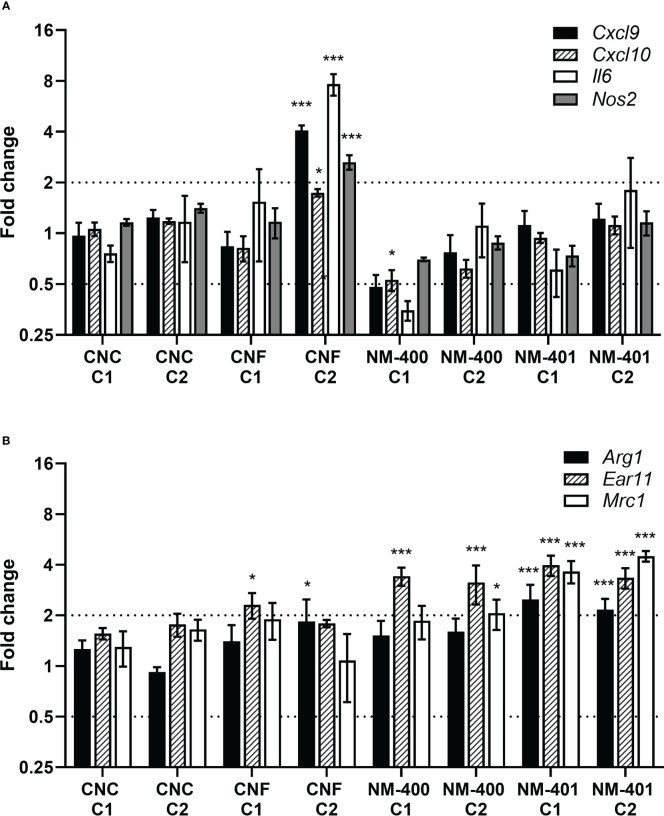
Figure 3.
Effects of nanomaterial exposure on the expression of common macrophage polarization markers. Changes in gene expression were assessed by qPCR following exposure to CNC, CNF, NM-400 and NM-401 in (A) M1 and (B) M2 macrophages. C1: 0.15 μg/cm2 and C2: 2.7 μg/cm2. Expression was related to the mean expression in unexposed control cells which was set to 1. Data represent mean ± SE, (n=5), *p<0.05, ***p<0.001.

