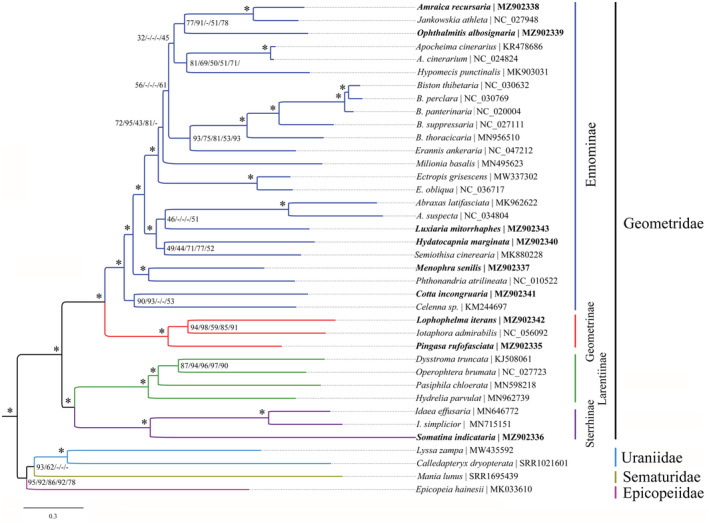
FIGURE 5.

Maximum likelihood (ML) tree inferred from IQ‐TREE method based on PCG123R dataset. The species with newly sequenced mitogenome is emphasized in bold. Numbers separated by slash (/) on node represent the bootstrap values based on the PCG123R, PCG123, PCG12R, PCG12, and PCGAA datasets, respectively. The “*” on node represents bootstrap values ≥90 for all datasets. The “‐” represents an unrecovered node in ML tree of the corresponding dataset.
