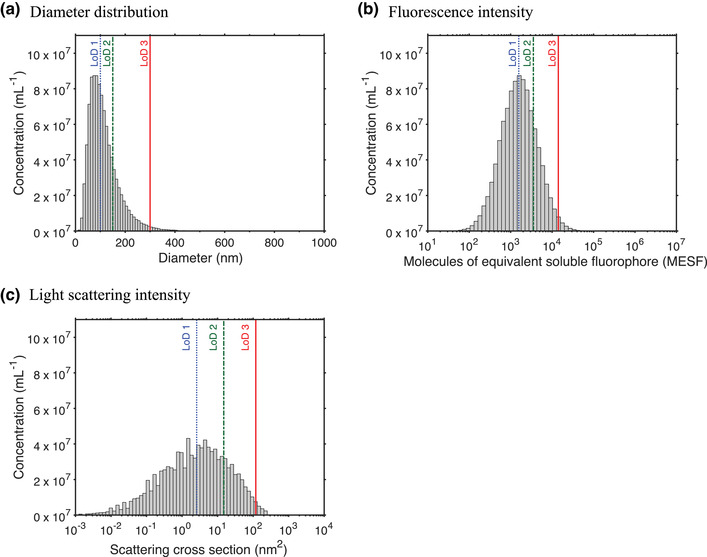
FIGURE 12.

The lower limit of detection (LoD) of a flow cytometer affects the statistical description of the size distribution, fluorescence intensity distribution, and light scattering intensity distribution of an extracellular vesicle (EV) sample. (A) Size distribution, (B) fluorescence intensity distribution, and (C) light scattering intensity distribution of the same population of EVs. The vertical lines denote three LoDs relating to diameters of 100 nm (dotted line), 150 nm (dashed line), and 300 nm (solid line). The effect of these LoDs for statistical descriptions of the size distribution, fluorescence intensity distribution, and light scattering intensity distribution can be found in Tables 4 and 5.
