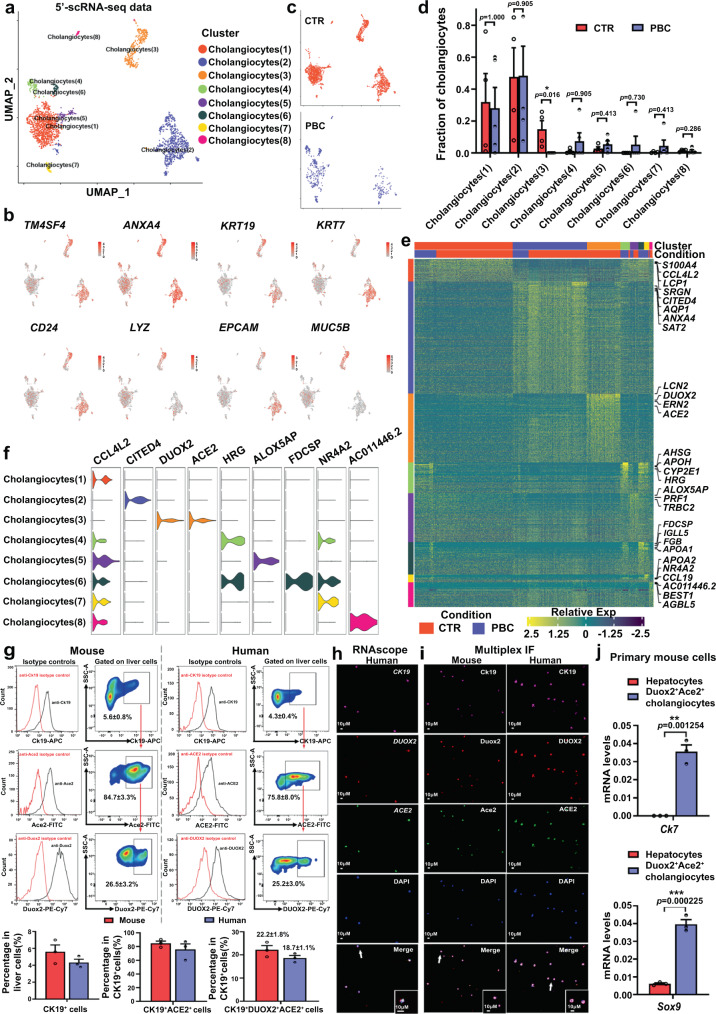
Fig. 2. Identification of unique DUOX2+ACE2+ small cholangiocytes in human and mouse livers.
a UMAP analysis of 2,209 cholangiocytes from four control (CTR) and five primary biliary cholangitis (PBC) livers identified eight distinct clusters of cholangiocyte (1) to (8). b Canonical marker genes were highly expressed in different clusters of cholangiocytes in human livers. c Cluster distribution of cells in control livers (orange) and PBC livers (blue). d The proportions of cholangiocyte subpopulations in control and PBC livers. CTR: n = 4 liver samples from CTR patients, PBC: n = 5 liver samples from PBC patients; Plotted: mean ± SEM; Statistics: two-tailed Mann-Whitney U test, 95% confidence interval; *p < 0.05. e Heatmap displayed the relative expression levels of marker genes in different clusters of cholangiocytes (top, color-coded by cluster and condition), with exemplar genes labeled (right). Columns denote cells; rows denote genes. f Violin plots showing the expression levels of enriched marker genes across distinct cholangiocyte subpopulations. g Flow cytometry analysis and cell sorting of primary CK19+DUOX2+ACE2+ cells in the livers of three wild-type mice and three control patients. Mouse: n = 3 mouse liver samples, Human: n = 3 human liver samples; Plotted: mean ± SEM. h Representative photomicrographs of sorted primary human CK19+DUOX2+ACE2+ cells that had been analyzed using RNAscope with probes for CK19 (purple), DUOX2 (red) and ACE2 (green). Scale bars: 10 μm. n = 3 independent experiments. i Representative photomicrographs of sorted primary mouse Ck19+Duox2+Ace2+ cells and human CK19+DUOX2+ACE2+ cells analyzed using multiplex immunofluorescence (IF) with antibodies against CK19 (purple), DUOX2 (red) and ACE2 (green). Scale bars: 10 μm. n = 3 independent experiments. j Specific cholangiocyte markers, Ck7 and Sox9, were highly expressed in primary mouse Ck19+Duox2+Ace2+ cells, but not in primary mouse hepatocytes. Plotted: mean ± SEM. n = 3 independent experiments; Statistics: two-tailed independent-sample Student’s t test, 95% confidence interval; **p < 0.01, ***p < 0.001. Source data are provided as a Source Data file.

