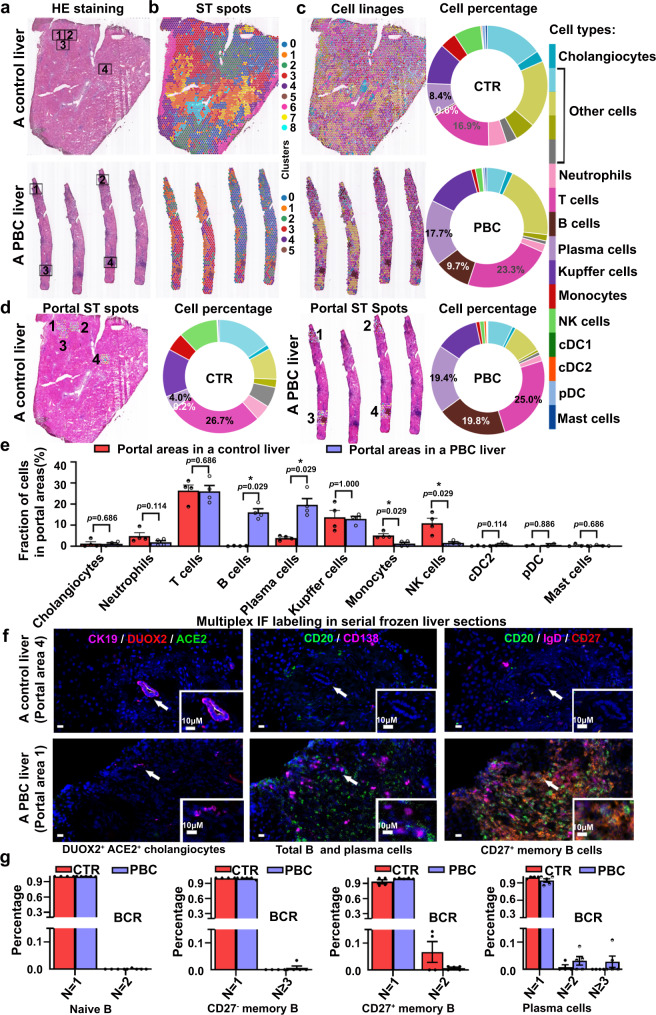
Fig. 4. CD27+ memory B and plasma cells accumulate in the hepatic portal areas of PBC patients.
a Images of hematoxylin-eosin (HE) staining in liver sections from a control (CTR) subject and a primary biliary cholangitis (PBC) patient. Four typical portal areas were randomly selected from each section for further analyses. b Unbiased clustering of spatial transcriptomic (ST) spots in the CTR and the PBC liver sections, which identified 9 and 6 distinct clusters, respectively. c The distribution of cell linages and their proportions in the CTR and PBC liver sections. NK cells natural killer cells, cDC1 conventional type 1 dendritic cells, cDC2 conventional type 2 dendritic cells, pDC plasmacytoid dendritic cells. d Spatial distribution of annotated cell linages and their proportions in the selected 4 portal areas of the CTR and PBC liver sections. e The proportions of different types of cells in the portal areas of the CTR and PBC liver sections. CTR: n = 4, PBC: n = 4; Plotted: mean ± SEM; Statistics: two-tailed Mann–Whitney U test, 95% confidence interval; *p < 0.05. f Representative multiplex immunofluorescence (IF) photomicrographs of DUOX2+ACE2+ small cholangiocytes (CK19+ACE2+DUOX2+, white), B cells (CD20+, green), plasma cells (CD138+, purple), and CD27+ memory B cells (CD20+IgD-CD27+, orange) in the portal areas of serial frozen liver sections of the CTR (Portal area 4) and PBC liver (Portal area 1). Scale bars: 10 μm. n = 3 independent experiments. g The distribution of B-cell receptor (BCR) clonotypes in B cell subtypes of the CTR and PBC groups. The N represents the number of cells for a clonotype; N = 1: a clonotype only in one cell; N = 2: a clonotype in two cells; and N = 3: a clonotype in ≥3 cells. The y axis represents the percentage of each clonotype in total clonotypes. CTR: n = 4 liver samples from CTR patients, PBC: n = 5 liver samples from PBC patients; Plotted: mean ± SEM. Source data are provided as a Source Data file.

