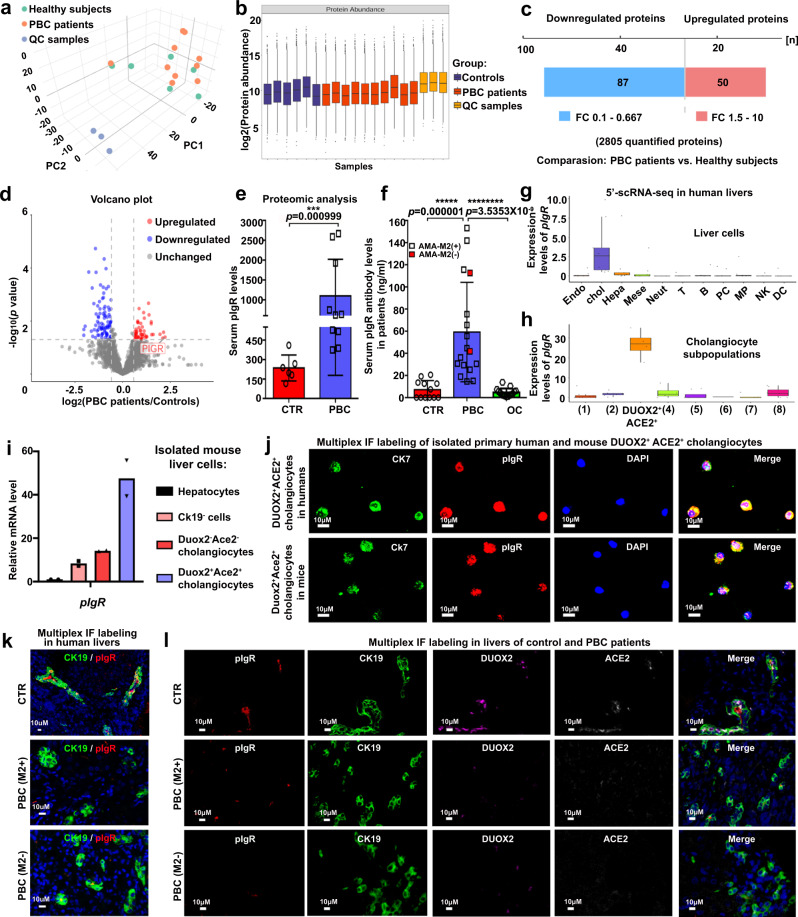
Fig. 6. The pIgR is mainly expressed in DUOX2+ACE2+ small cholangiocytes, while the levels of serum pIgR and its antibodies were significantly elevated in PBC patients.
a Score scatter plot corresponding to a principal components analysis (PCA) of the serum proteomics from six healthy subjects (CTR) and 10 primary biliary cholangitis (PBC) patients. QC quality control. b Quality control for CTR and PBC samples. The center line shows the median, the box limits represent the upper and the lower quartiles, and the whiskers extend to the largest and smallest values. CTR: n = 6 serum samples from CTR patients; PBC: n = 10 serum samples from PBC patients. c The Changes in serum proteomics in PBC patients and CTR subjects. Significantly changed proteins were identified with a fold-change (FC) greater than 1.5 and p < 0.05, statistically analyzed by two-tailed independent-sample Student’s t test. d Volcano plot of the changes in protein abundance between CTR and PBC patients. Statistics: two-tailed independent-sample Student’s t test, 95% confidence interval. e The levels of serum pIgR protein obtained from proteomic analysis. CTR: n = 6 serum samples from CTR patients, PBC: n = 10 serum samples from PBC patients; Plotted: mean ± SEM; Statistics: two-tailed Mann–Whitney U test, 95% confidence interval; ***p < 0.001. f The levels of serum anti-pIgR autoantibodies in CTR, PBC, and obstructive cholestasis (OC) patients. CTR: n = 12 serum samples from CTR patients, PBC: n = 17 serum samples from PBC patients, OC: n = 15 serum samples from OC patients; Plotted: mean ± SEM; Statistics: two-tailed Mann-Whitney U test, 95% confidence interval; *****p < 0.00001, ********p < 0.00000001. g, h The pIgR was mainly expressed in cholangiocytes (g) and highly expressed in DUOX2+ACE2+ small cholangiocytes (h) in human liver from the analysis of 5′-scRNA-seq data. The center line shows the median, the box limits represent the upper and the lower quartiles, and the whiskers extend to the largest and smallest values. n = 9 human liver samples. Endo endothelial cells, Chol cholangiocytes, Hepa hepatocytes, Neut neutrophils, PC plasma cells, MP mononuclear phagocytes, NK natural killer cells, DC dendritic cells. i The relative levels of pIgR mRNA transcripts in Duox2+Ace2+ or Duox2-Ace2- cholangiocytes, Ck19- cells and hepatocytes from normal mouse livers. n = 2 independent experiments. j Representative multiplex immunofluorescence (IF) photomicrographs of CK7 (green), pIgR (red) and DAPI (blue) in primary human DUOX2+ACE2+ small cholangiocytes and mouse Duox2+Ace2+ small cholangiocytes. Scale bars: 10 μm. n = 3 independent experiments. k Representative multiplex IF photomicrographs of CK19 (green) and pIgR (red) in liver sections of CTR and PBC patients with positive AMA-M2 or negative AMA-M2. Scale bars: 10 μm. n = 3 independent experiments. l Representative multiplex IF photomicrographs of pIgR (red), CK19 (green), DUOX2 (purple), ACE2 (gray white), and DAPI (blue) in liver sections of CTR and PBC patients with positive AMA-M2 or negative AMA-M2. Scale bars: 10 μm. n = 3 independent experiments. Source data are provided as a Source Data file.

