Figure 7.
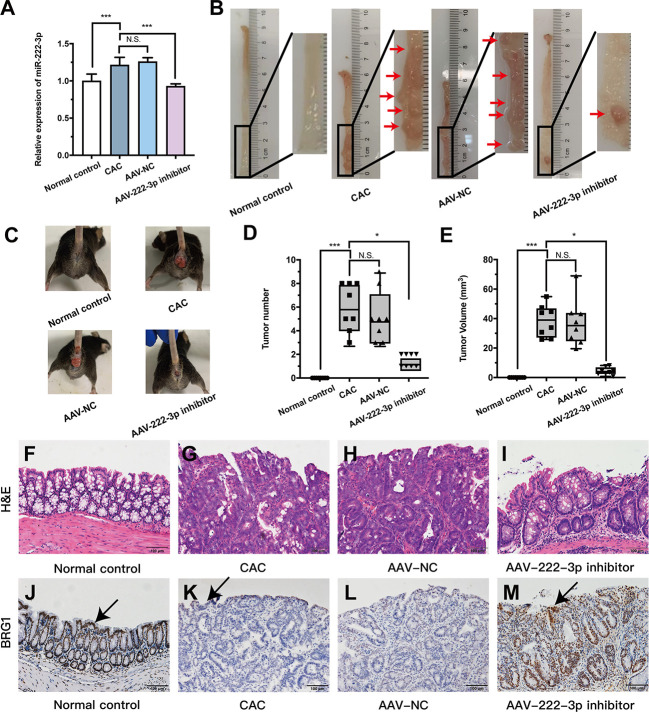
MiR-222-3p inhibitor plays CAC-suppressive roles in vivo. (A) qRT-PCR analysis of miR-222-3p in the IECs from AOM/DSS-induced mice. (B) Macroscopic images of tumors in the intestines of AOM/DSS-induced mice. (C) Images of AOM/DSS-induced mice. (D, E) Intestinal tumor numbers and tumor volumes were recorded. (F–I) morphological observation with H&E-stained colon sections as indicated. (J–M) Immunohistochemical analyses of BRG1 expression in colon tissues, and arrows indicate IECs locations. Data are presented as the median (P25, P75) (n = 8) in (D, E) and mean ± SD in (A) (n = 8). * P < 0.05, *** P < 0.001. Normal control: Normal control group; CAC: CAC group; AAV-NC: CAC+ AAV-negative control group; AAV-222-3p inhibitor: CAC+ miR-222-3p inhibitor group. Scale bar: 100 µm. N.S., no significance.

