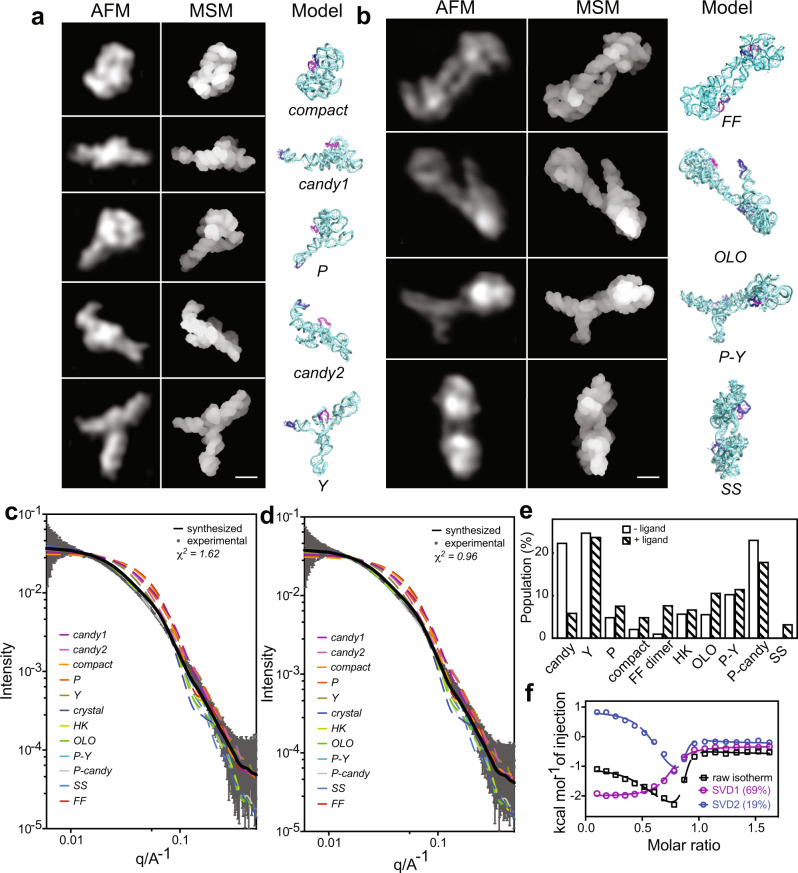
Fig. 2. Recapitulated 3D topological structures of the rCbl heterogeneous conformers corroborated by SAXS and ITC.
a, b Individual particles cropped from the experimental AFM images shown in Fig. 1a, b, the recapitulated structures in the molecular surface model (MSM) and cartoon models for the monomeric (a) and dimeric (b) conformers. L5 and L13 are colored in magenta and blue, respectively. The scale bars of 5 nm are shown in the right bottom corner for (a) and (b). c, d Comparison of the experimental SAXS curve (gray solid line) with back-calculated SAXS curves of the individual conformers (colored dash lines) with the synthesized SAXS curve (black solid line). Experimental SAXS data were recorded for rCbl (1 µM) in the absence (c) or presence (d) of 10 µM AdoCbl. Data are presented as mean value + /− error (propagation of uncertainty) as bar and whisker (n = 223 measurements). The synthesized SAXS curves were calculated using the structures of all conformers (“Methods”) with χ2 = 1.62 for rCbl in the absence of ligand and χ2 = 0.96 for rCbl in the presence of ligand. e The conformer population tallies that generate the best fit to the experimental SAXS data. f Deconvoluted (SVD1 and SVD2) isotherms of rCbl titrated with AdoCbl (Supplementary Table 2). The eigenvalue fractions for principal component 1 (SVD1) and component 2 (SVD2) are about 69% and 19%, respectively. The raw isotherms are shown in Supplementary Fig. 4a. Source data are provided as a Source Data file.

