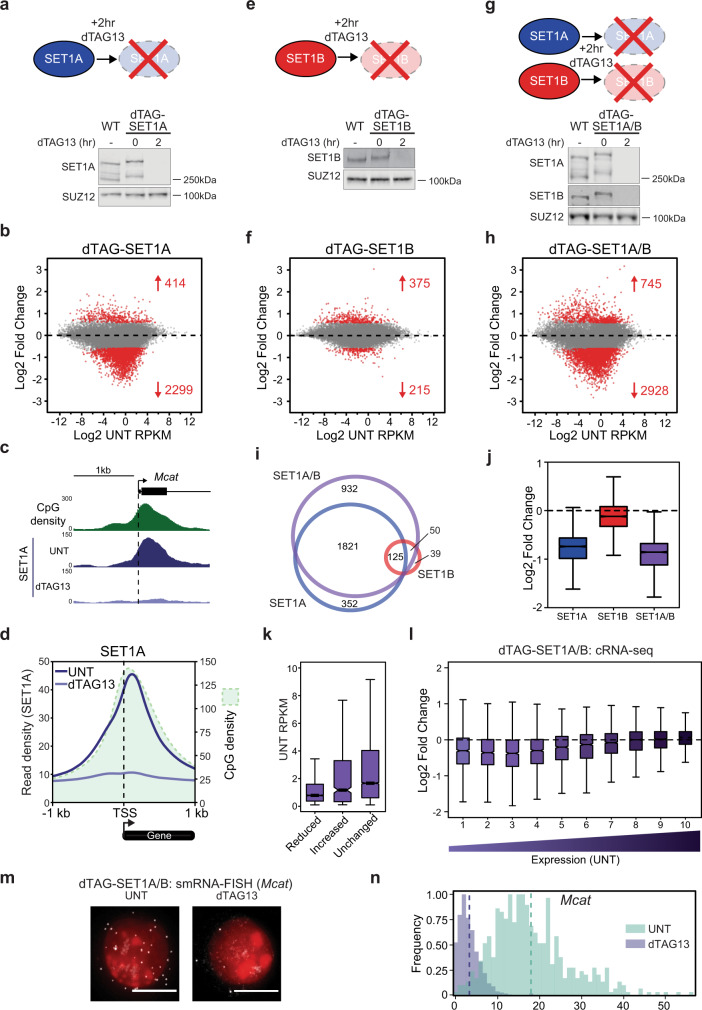
Fig. 1. SET1 complexes primarily enable expression of low to moderately expressed genes.
a A schematic illustrating the approach used to rapidly deplete SET1A (top panel). A representative western blot (n > 3) showing comparable SET1A levels in wild type (WT) and dTAG-SET1A lines (bottom panel), and that 2 h of dTAG13 treatment causes depletion of dTAG-SET1A. SUZ12 functions as a loading control. b An MA-plot showing log2 fold changes in cRNA-seq signal in the dTAG-SET1A line following 2 h of dTAG13 treatment (n = 20633), determined using DESeq2. Significant gene expression changes (p-adj < 0.05 and >1.5-fold) are coloured red and the number of significantly changed genes is indicated. c A genomic snapshot illustrating the preferential localisation of SET1A to the CpG-rich region downstream of the TSS at the expressed CGI-associated promoter of the Mcat gene. SET1A signal in untreated cells (UNT) and following 2 h of dTAG13 treatment is shown. d Metaplot analysis of SET1A binding (cChIP-seq) at CGI-associated TSSs in the T7-dTAG-SET1A line in cells that are either untreated (UNT, dark blue) or treated with dTAG13 for 2 h (light blue). Only TSSs that do not have a divergent TSS within 1 kb were analysed (n = 11,930). CpG density is shown by light green shading. e, f As per a, b but for the dTAG-SET1B line. g, h As per a, b but for the dTAG-SET1A/B line. i A Venn diagram showing the overlap between genes with a significant reduction in expression in the dTAG-SET1A, dTAG-SET1B, and dTAG-SET1A/B lines. j A box plot showing the log2 fold changes in cRNA-seq signal in each of the dTAG cell lines for the complete set of genes that rely on SET1 complexes for their expression (n = 3320). The boxes show interquartile range, centre line represents median, whiskers extend by 1.5× IQR or the most extreme point (whichever is closer to the median), while notches extend by 1.58× IQR/sqrt(n), giving a roughly 95% confidence interval for comparing medians. k A box plot showing the expression level in untreated cells (UNT RPKM) for expressed genes with reduced expression following 2 h of SET1A/B depletion (Reduced, n = 2544), increased expression (Increased, n = 495) and unchanged expression (Unchanged, n = 9989). Boxes are defined as in j. l A box pot showing the log2 fold change in cRNA-seq signal in the dTAG-SET1A/B line after 2 h dTAG13 treatment with expressed genes (n = 13,028) separated into deciles based on their expression level in untreated cells. Boxes are defined as in j. m Example images of smRNA-FISH for the Mcat gene in the dTAG-SET1A/B line, showing an untreated (UNT) cell and a cell treated with dTAG13 for 2 h. White corresponds to Mcat RNAs and red corresponds to DAPI staining of DNA. The white scale bars correspond to 10 μm. n A histogram illustrating the number of transcripts per cell as measured by smRNA-FISH before (UNT, light green) and after 2 h of dTAG13 treatment (light purple) for the Mcat gene in the dTAG-SET1A/B line. The dashed lines correspond to the mean of the distribution.

