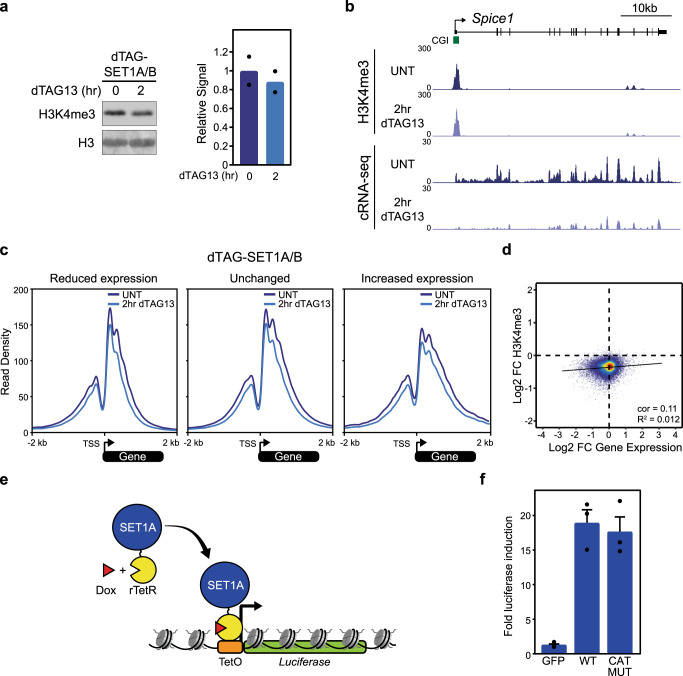
Fig. 2. SET1 complexes can regulate gene expression independently of H3K4me3 and methyltransferase activity.
a Western blot analysis of H3K4me3 levels in the untreated dTAG-SET1A/B line and following 2 h of dTAG13 treatment (left panel). H3 is included as a loading control. Mean H3K4me3 levels before and after dTAG13 treatment from two biological replicates is shown (right panel). b A genomic snapshot comparing H3K4me3 cChIP-seq signal (top panels) and cRNA-seq signal (bottom panels) before and after 2 h of dTAG13 treatment in the dTAG-SET1A/B line at the Spice1 gene. c Metaplot analysis of H3K4me3 cChIP-seq around the transcription start site (TSS) of genes that have reduced expression (left panel), unchanged expression (middle panel), or increased expression (right panel) in the dTAG-SET1A/B line, before (UNT, dark blue lines) and after 2 h of dTAG13 treatment (light blue lines). Only expressed genes are included (reduced expression, n = 2544; unchanged, n = 9989; increased expression, n = 495). d A scatter plot comparing the log2 fold change (Log2 FC) in H3K4me3 cChIP-seq signal and cRNA-seq signal (gene expression) in the dTAG-SET1A/B line following 2 h of dTAG13 treatment. The pearson correlation (cor) and R2 values are indicated. Only genes that have a peak of H3K4me3 in untreated cells are included (n = 14065). e A schematic illustrating the chromatinised reporter gene. TetO binding sites are coupled to a minimal core promoter and a luciferase reporter gene. rTetR-fusion proteins are tethered to the reporter gene by the addition of doxycycline (Dox) and effects on gene expression can be monitored. f A bar plot showing the mean fold induction of reporter gene expression following tethering of GFP, SET1A (WT) and SET1A with catalytic mutations in its SET domain (CAT MUT). Error bars represent SEM from three biological replicates.

