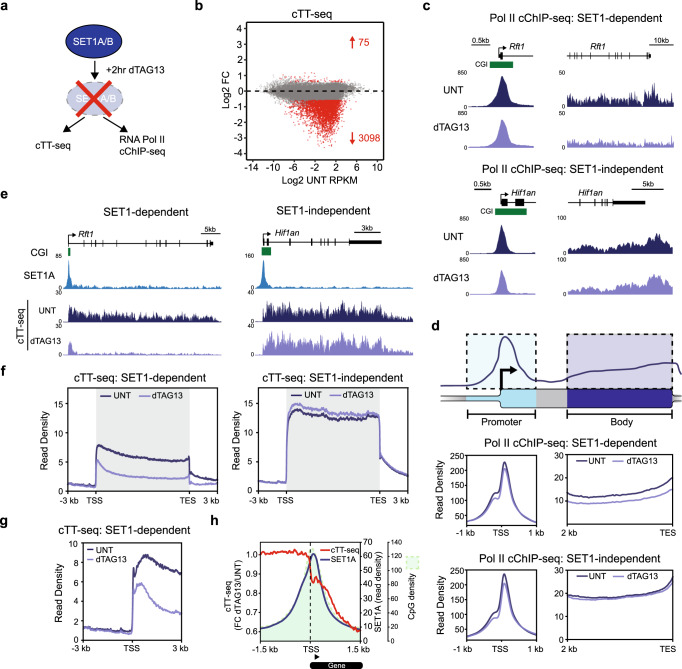
Fig. 4. SET1 complexes support genic transcription downstream of the TSS.
a A schematic illustrating the experiments carried out in the dTAG-SET1A/B line to examine RNA Pol II occupancy (RNA Pol II cChIP-seq) and transcription (cTT-seq). b An MA-plot showing log2 fold changes (Log2 FC) in transcription (cTT-seq) in the dTAG-SET1A/B line following 2 h of dTAG13 treatment (n = 20633), determined using DESeq2. Significant changes in transcription (p-adj < 0.05 and >1.5-fold) are coloured red and the number of significantly changed genes is indicated. c Genomic snapshots of RNA Pol II occupancy (Pol II cChIP-seq) at a SET1-dependent (upper panel, Rft1) and SET1-independent (lower panel, Hif1an) gene in untreated cells (UNT, dark purple) or cells treated with dTAG13 for 2 h (light purple). CGIs are shown in green. The left hand panels correspond to gene promoter occupancy and the right hand panels to gene body occupancy. d The top panel is a cartoon schematic illustrating the typical RNA Pol II cChIP-seq signal over a gene with the gene promoter region highlighted in light blue and the gene body in light purple. The bottom panels correspond to metaplot analysis of RNA Pol II cChIP-seq signal in the dTAG-SET1A/B line in cells that are either untreated (UNT) or treated with dTAG13 for 2 h. The RNA Pol II cChIP-seq signal corresponding to the gene promoter and body regions (see schematic in top panel) of all transcribed SET1-dependent genes (middle panel, n = 2633) and SET1-independent genes (bottom panel, n = 9151) is shown. e Genomic snapshots of cTT-seq signal in the dTAG-SET1A/B line at a SET1-dependent (left panel, Rft1) and SET1-independent (right panel, Hif1an) gene in untreated cells (UNT, dark purple) or cells treated with dTAG13 for 2 h (light purple). The CGIs are shown in green and SET1A cChIP-seq signal in light blue. f Metaplot analysis of transcription (cTT-seq) in the dTAG-SET1A/B line in cells that are either untreated (UNT, dark purple) or treated with dTAG13 for 2 h (light purple) for all actively transcribed SET1-dependent genes (left panel, n = 2633) and SET1-independent genes (right panel, n = 9151). g Metaplot analysis of transcription (cTT-seq) in the dTAG-SET1A/B line in cells that are either untreated (UNT, dark purple) or treated with dTAG13 for 2 h (light purple) zoomed in to the transcription start site (TSS) of all actively transcribed SET1-dependent genes (n = 2633). h Metaplot analysis of the fold change in cTT-seq signal (red line) between dTAG13-treated and untreated dTAG-SET1A/B cells at the transcription start site (TSS) of all transcribed SET1-dependent genes (n = 2633). Following SET1A depletion, the attenuation of transcription occurs downstream of TSSs over the CpG-rich region (green shaded area) of the CGI, coincident with the location of SET1A binding in untreated cells (dark blue line).

