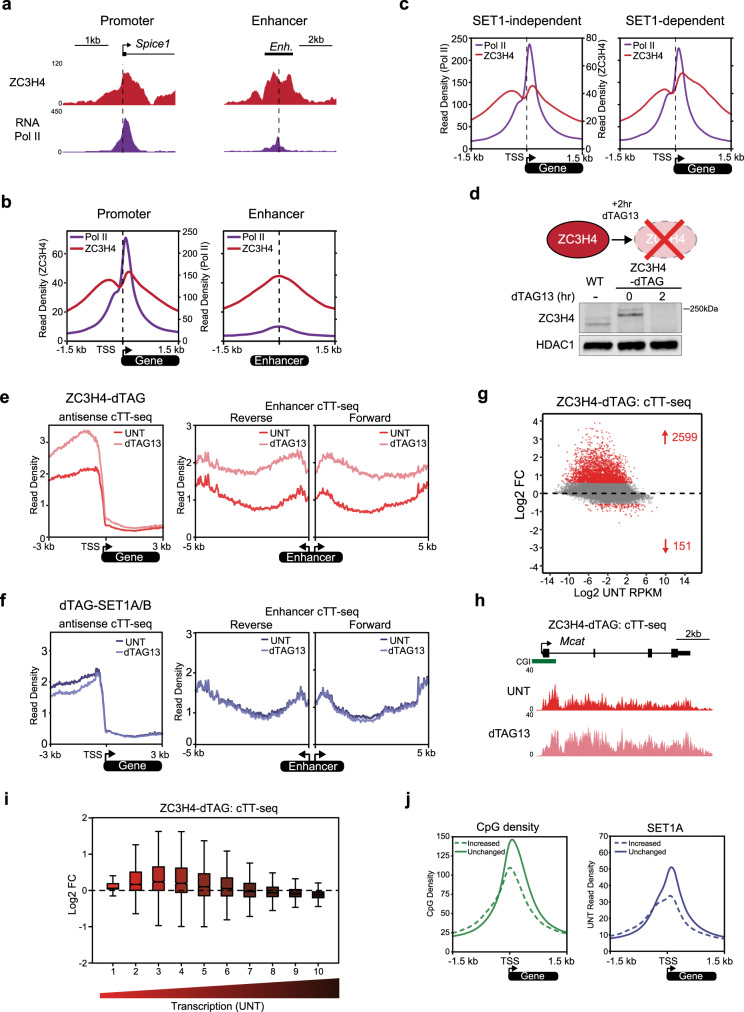
Fig. 5. ZC3H4 terminates low to moderately transcribed extragenic and genic transcription.
a Genomic snapshots illustrating ZC3H4 and RNA Pol II ChIP-seq signal at the promoter of the Spice1 gene (left panel) and an intergenic enhancer region (chr16:30,818,164-30,824,484) (right panel). b Metaplot analysis of ZC3H4 and RNA Pol II ChIP-seq at the TSSs of transcribed genes (n = 11,823, left panel) and enhancers (n = 4156, right panel). The read density of ZC3H4 is shown on the left axis and RNA Pol II is shown on the right axis. c Metaplot analysis of RNA Pol II and ZC3H4 ChIP-seq at the TSSs of transcribed SET1-independent (n = 9151) and SET1-dependent genes (n = 2633). The read density of RNA Pol II is shown on the left axis and read density of ZC3H4 on the right axis. d A schematic illustrating the ZC3H4-dTAG line and a representative western blot (n = 3) comparing ZC3H4 levels in wild type (WT) cells and the ZC3H4-dTAG line before (0 h) and following 2 h treatment with dTAG13. HDAC1 functions as a loading control. e Metaplot analysis of transcription (cTT-seq) in the ZC3H4-dTAG line that is either untreated (UNT, dark red) or treated with dTAG13 for 2 h (light red), showing upstream antisense transcription at all TSSs (left panel, n = 20,633) and enhancer transcription (right panels, n = 4156). f As in e, but for the dTAG-SET1A/B cell line. g An MA-plot showing log2 fold changes (Log2 FC) in transcription (cTT-seq) in the ZC3H4-dTAG line following 2 h treatment with dTAG13 (n = 20,633), determined using DESeq2. Significant changes in transcription (p-adj < 0.05 and >1.5-fold) are coloured red and the number of significantly changed genes is indicated. h A genomic snapshot of cTT-seq signal in the ZC3H4-dTAG line at the Mcat gene in untreated cells (UNT) or cells treated with dTAG13 for 2 h. i A box pot showing log2 fold change (Log2 FC) in transcription (cTT-seq) in the ZC3H4-dTAG line after 2 h dTAG13 treatment with all genes (n = 20,633) separated into deciles based on their transcription level in untreated cells. The boxes show interquartile range, centre line represents median, whiskers extend by 1.5× IQR or the most extreme point (whichever is closer to the median), while notches extend by 1.58× IQR/sqrt(n), giving a roughly 95% confidence interval for comparing medians. j Metaplots comparing CpG density and SET1A levels at the TSSs of CGI-associated genes that are increased in transcription after 2 h of ZC3H4 depletion (n = 1653) and those that are unchanged (n = 12,667).

