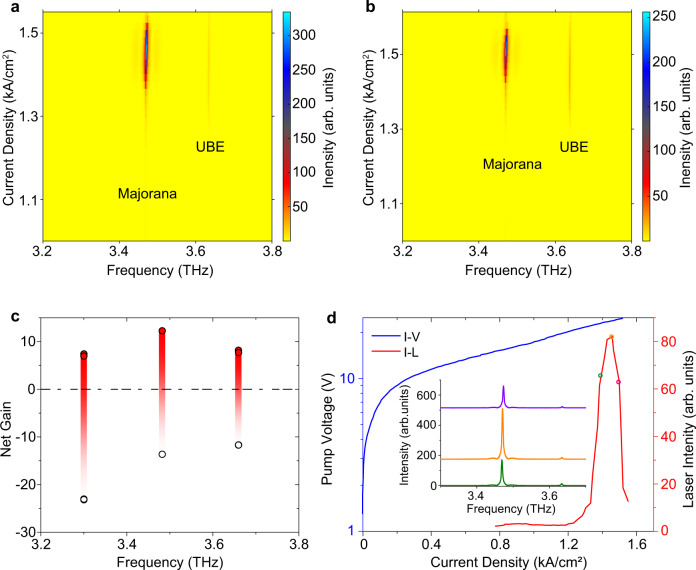
Fig. 3. Observation of lasing Majorana zero modes.
a, b Emission intensity spectra for different pump current densities, obtained using samples with lattice constant μm and winding number of , respectively. c Calculated net gain coefficients before and after the laser devices are pumped. d Light-current-voltage (L-I-V) curve for the sample with winding number of +1 (the other sample behaves similarly, see the Supplementary Materials for more details). These intensities are obtained by integrating over only the emission peak of the photonic MZM. The inset figure shows typical emission spectra at different pump current intensities, from which the maximum SMSR is calculated to be larger than 14.7 dB.

