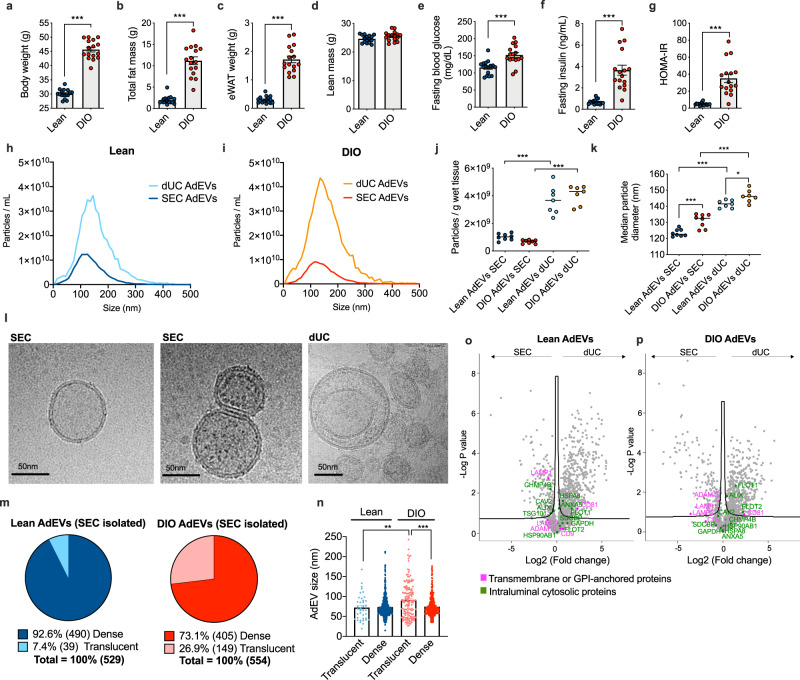
Fig. 1. Comparative assessment of AdEVs isolated by dUC or SEC.
Male lean and diet-induced obese (DIO) C57BL/6 J mice (n = 16 mice, 24–26 weeks of age, 16 weeks of feeding) were assessed for a body weight, b fat mass, c epididymal white adipose tissue (eWAT) mass, d lean mass, e fasting glucose, f fasting insulin, and g HOMA-IR values. h–k Nanoparticle Tracking Analysis (NTA) of adipocyte-derived extracellular vesicles (AdEVs, n = 7–8 biological replicates from two different EV isolation experiments) with size distributions of AdEVs from h lean and i DIO mice, j numbers of particles per gram wet tissue and k median particle diameters of the isolated EVs. l Representative cryo-TEM images from two independent AdEVs isolations using size exclusion chromatography (SEC) with translucent (left) and dense (middle) lumen or by differential ultracentrifugation (dUC) (right image). m Cryo-TEM-determined dense/translucent percentage, n median AdEV diameter of dense and translucent AdEVs. o–p LC-MS/MS analysis of the protein abundance of EV markers listed in the MISEV guideline. Comparison of EV markers in SEC- and dUC-isolated AdEVs from o lean and p DIO mice (n = 4 independent AdEV replicate samples. Each AdEV sample was isolated from visceral fat pads pooled from 5 DIO or 10 lean male 6–8 months old C57BL/6 J mice subjected to 4–6 months of HFD or chow). a–p Data are presented as mean values ± SEM, asterisks indicate *P < 0.05, **P < 0.01, ***P < 0.001. a–g Significance was determined by unpaired two-tailed t-tests, j, k, n One-Way ANOVA with Sidak’s post-test, or o, p One-Way ANOVA with a false discovery rate (FDR) of 0.1. Exact P values are (a–b, f, g, dietary effects) P < 0.0001, e P = 0.0003, (j isolation methods) P < 0.0001, k P < 0.0001 for all comparisons except for P = 0.0004 for lean AdEVs SEC vs. DIO AdEVs SEC and P = 0.390 for lean AdEVs dUC vs. DIO AdEVs dUC. Exact P values for EV size and lumina morphology are n P = 0.0011 (AdEV size of lean translucent vs. DIO translucent) and P < 0.0001 (AdEV size of DIO translucent vs. DIO dense).

