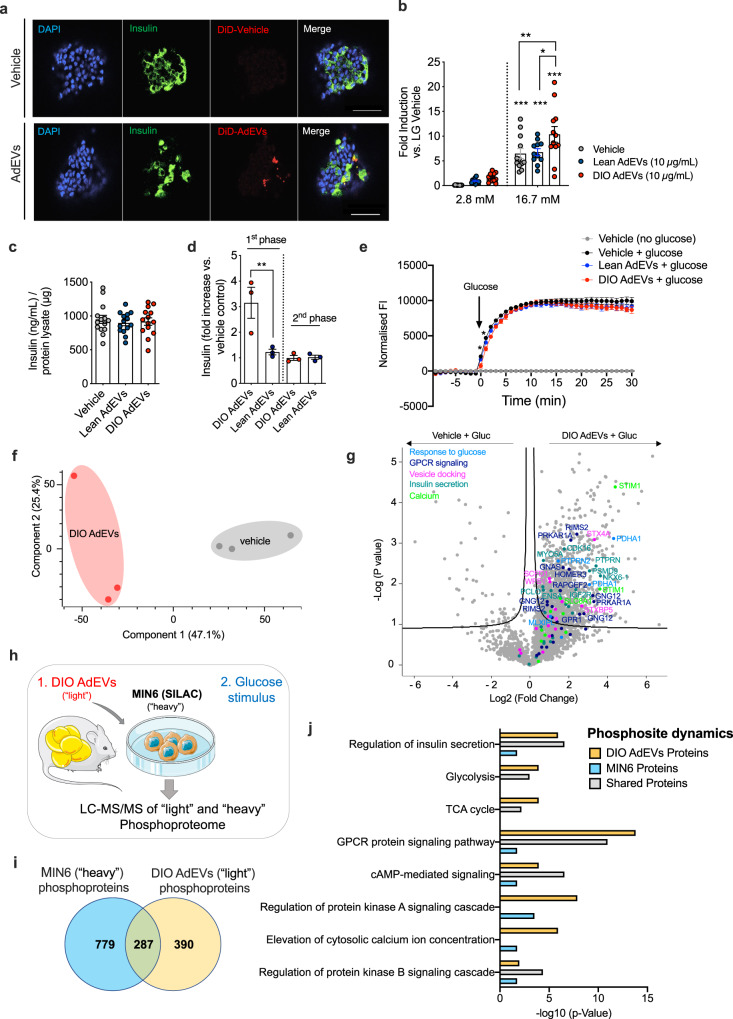
Fig. 4. AdEVs from DIO mice enhance GSIS in pancreatic β-cells.
Primary murine islets for experiments a–d were isolated from male C57BL/6 mice (16–18 weeks of age). AdEVs were isolated from male C57BL/6 J DIO mice (a–j: 4–6 months of HFD) or b from age and sex matched lean recipient C57BL/6 J mice. a Representative laser scanning confocal microscopy images of murine pancreatic islets after treatment with DiD-vehicle control (upper panel) or 10 µg of DiD-labeled AdEVs isolated from fat pads of DIO mice (lower panel). Scale bars: 50 µm. Nuclear staining via DAPI (blue), β-cell staining via anti-insulin antibody (green). b GSIS and c total insulin content in murine islets exposed to vehicle, lean or DIO AdEVs (10 µg/mL) followed by low glucose (LG) 2.8 mM and 16.7 mM glucose (n = 11–12 wells with primary murine islets treated with AdEVs from lean mice (n = 11 biologically independent samples), DIO mice (n = 12 biologically independent samples) from three independent isolations) or vehicle n = 12. d Dynamic islet perfusion assay in murine islets. Box plots represent the area under the curve of the first- and second phase of insulin secretion, expressed as fold increase vs. vehicle control (n = 3 biologically independent samples). e Real-time monitoring of glucose uptake into MIN6 cells expressing glucose sensitive Green Glifon600 and pretreated for 6 hrs with vehicle or AdEVs from lean or DIO mice (n = 4 biologically independent samples). Data represent baseline corrected fluorescence intensities (FI). f PCA and g Volcano Plot (ANOVA, FDR = 0.1) of MIN6 phosphoproteomes 15 min after switching from low to high glucose. Cells were pretreated with DIO AdEVs or vehicle for 6 hrs. h–j Independent replication experiment with SILAC-labeled and DIO AdEV-pretreated MIN6 cells. h experimental setup, i Venn diagram of significant phosphosite changes for heavy MIN6, light AdEV-derived proteins, or both after a glucose stimulus (FDR = 0.05). j Bar diagram of enrichment analysis (two-sided Fisher’s Exact Test, FDR = 0.005) of MIN6 and AdEV-specific phosphosite changes related to pathways involved in insulin secretion. Significance levels for the different enrichment classes are displayed as -log10 p-values. b–e Data are presented as mean values ± SEM. Asterisks indicate *P < 0.05, **P < 0.01, ***P < 0.001. Significance was determined by b two-way ANOVA and Tukey’s multiple comparisons test or d ordinary one-way ANOVA and Sidak’s multiple comparisons test. Exact P values are b P = 0.0047 for DIO AdEV treatment vs. vehicle at the 16.7 mM glucose condition; c P = 0.011 for the comparison of lean AdEV vs. DIO AdEV treatment and d P = 0.0025. e For exact p-values at individual time points see the data source files. The graphic in h was compiled using elements provided by Servier Medical Art (https://smart.servier.com).

