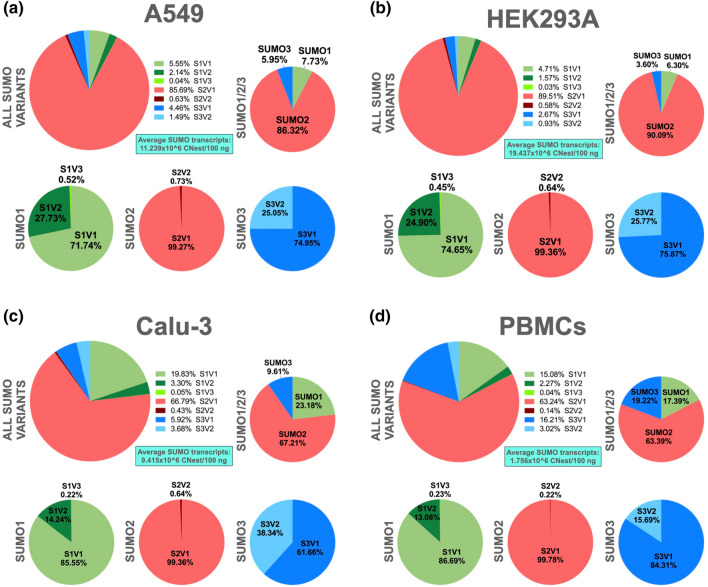
Figure 3.
In human PBMCs and in three different cell lines of human origin, the normally spliced transcripts represent the most abundant SUMO transcripts, with SUMO2V1 constituting the most abundant of all. RT-qPCR analyses were performed as described in Materials and Methods to assess the Copy Number estimates (CNest) for each SUMO variant, using the previously validated primers described in Fig. 2. The resulting average values for each transcript were added together to calculate the total CNest for all SUMO transcripts, as well as for each SUMO paralog. Using these numbers, the respective percentages corresponding to each transcript in relation to either, all SUMO transcripts (ALL SUMO VARIANTS) or to the total transcripts for its specific SUMO paralog (SUMO1, SUMO2, and SUMO3), were subsequently estimated. The calculated average CNest values for all SUMO transcripts per 100 ng of total RNA (Average SUMO transcripts) are shown for each cell type. (a) A549 cells. (b) HEK293A cells. (c) Calu-3 cells. (d) Peripheral blood mononuclear cells (PBMCs) derived from normal donors. Samples from three different donors were used in these analyses. All data represents the average values obtained from triplicate measurements in three independent experiments. For the corresponding data represented as bar graphs with error lines, see Supplementary Fig. S1. Notice that in this figure and in all subsequent figures, the labeling used to indicate the various SUMO variants has been simplified, so instead of spelling out the SUMO paralog, it is simply indicated as S, so SUMO1V1 is shown as S1V1, SUMO1V2 is shown as S1V2, and so forth.

